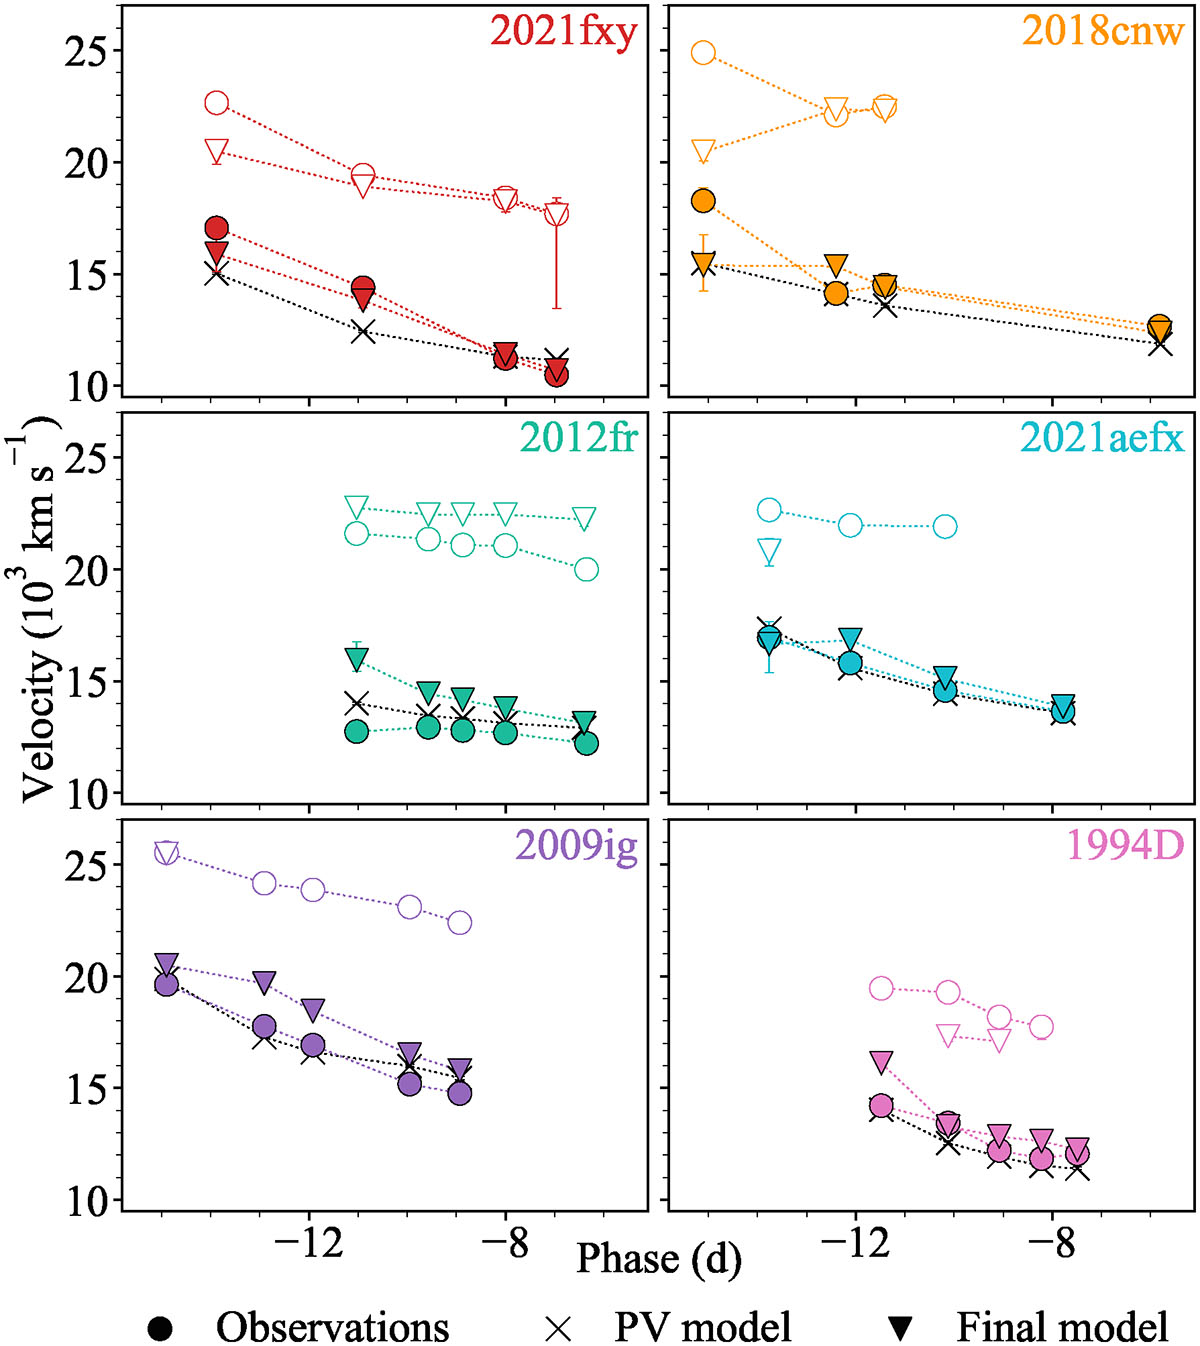
Fig. 6.
Download original image
Comparison of the velocities from the best-fitting models and the observed spectra. The solid symbols represent the PV components; the open symbols are their HV counterparts. The circles and triangles correspond to the observations and simulations, respectively; the crosses display the measurements from the PV model spectra in Fig. A.2.
Current usage metrics show cumulative count of Article Views (full-text article views including HTML views, PDF and ePub downloads, according to the available data) and Abstracts Views on Vision4Press platform.
Data correspond to usage on the plateform after 2015. The current usage metrics is available 48-96 hours after online publication and is updated daily on week days.
Initial download of the metrics may take a while.