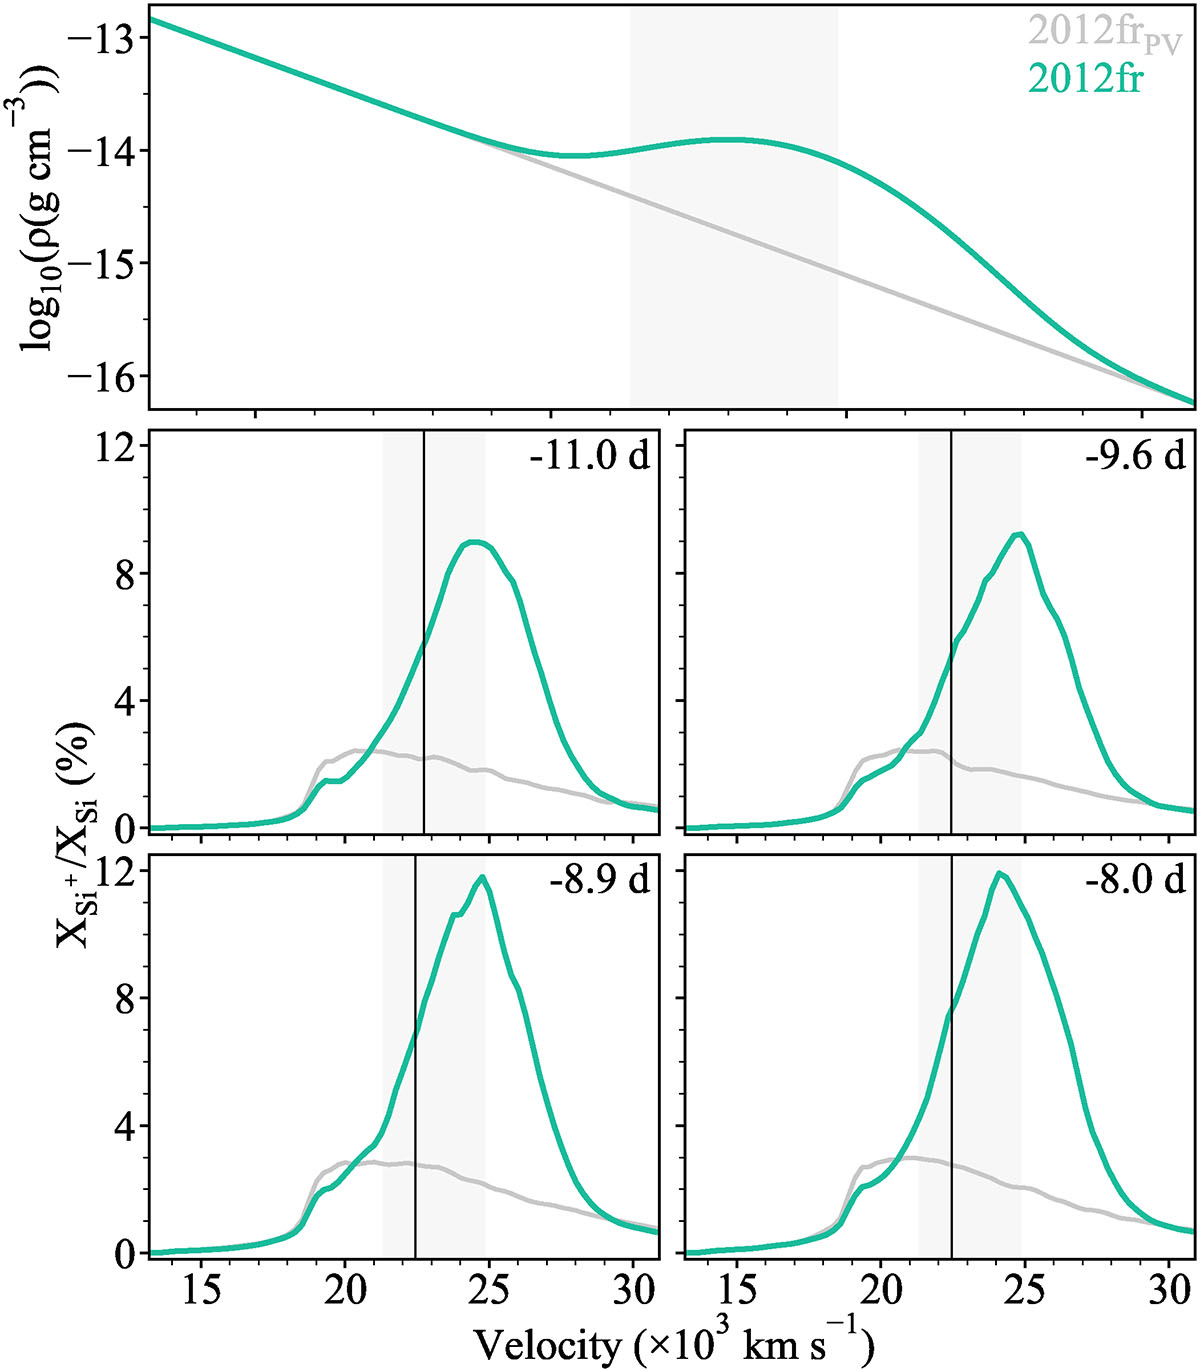
Fig. 7.
Download original image
Top: Density profiles from the PV model (grey) and the density enhancement model (green) for SN 2012fr. Bottom: Relative fraction of silicon material in the singly ionised state for the PV model (grey) and the density enhancement model (green) across the first four epochs of SN 2012fr. The black vertical lines correspond to the measured HVF velocities from the synthesised spectra. The shaded region represents the velocity range centred at b with width 2c (i.e. from b − c to b + c), where b and c are the centroid and width of the Gaussian density enhancement, respectively, as given in Table 1.
Current usage metrics show cumulative count of Article Views (full-text article views including HTML views, PDF and ePub downloads, according to the available data) and Abstracts Views on Vision4Press platform.
Data correspond to usage on the plateform after 2015. The current usage metrics is available 48-96 hours after online publication and is updated daily on week days.
Initial download of the metrics may take a while.