Open Access
Fig. 9.
Download original image
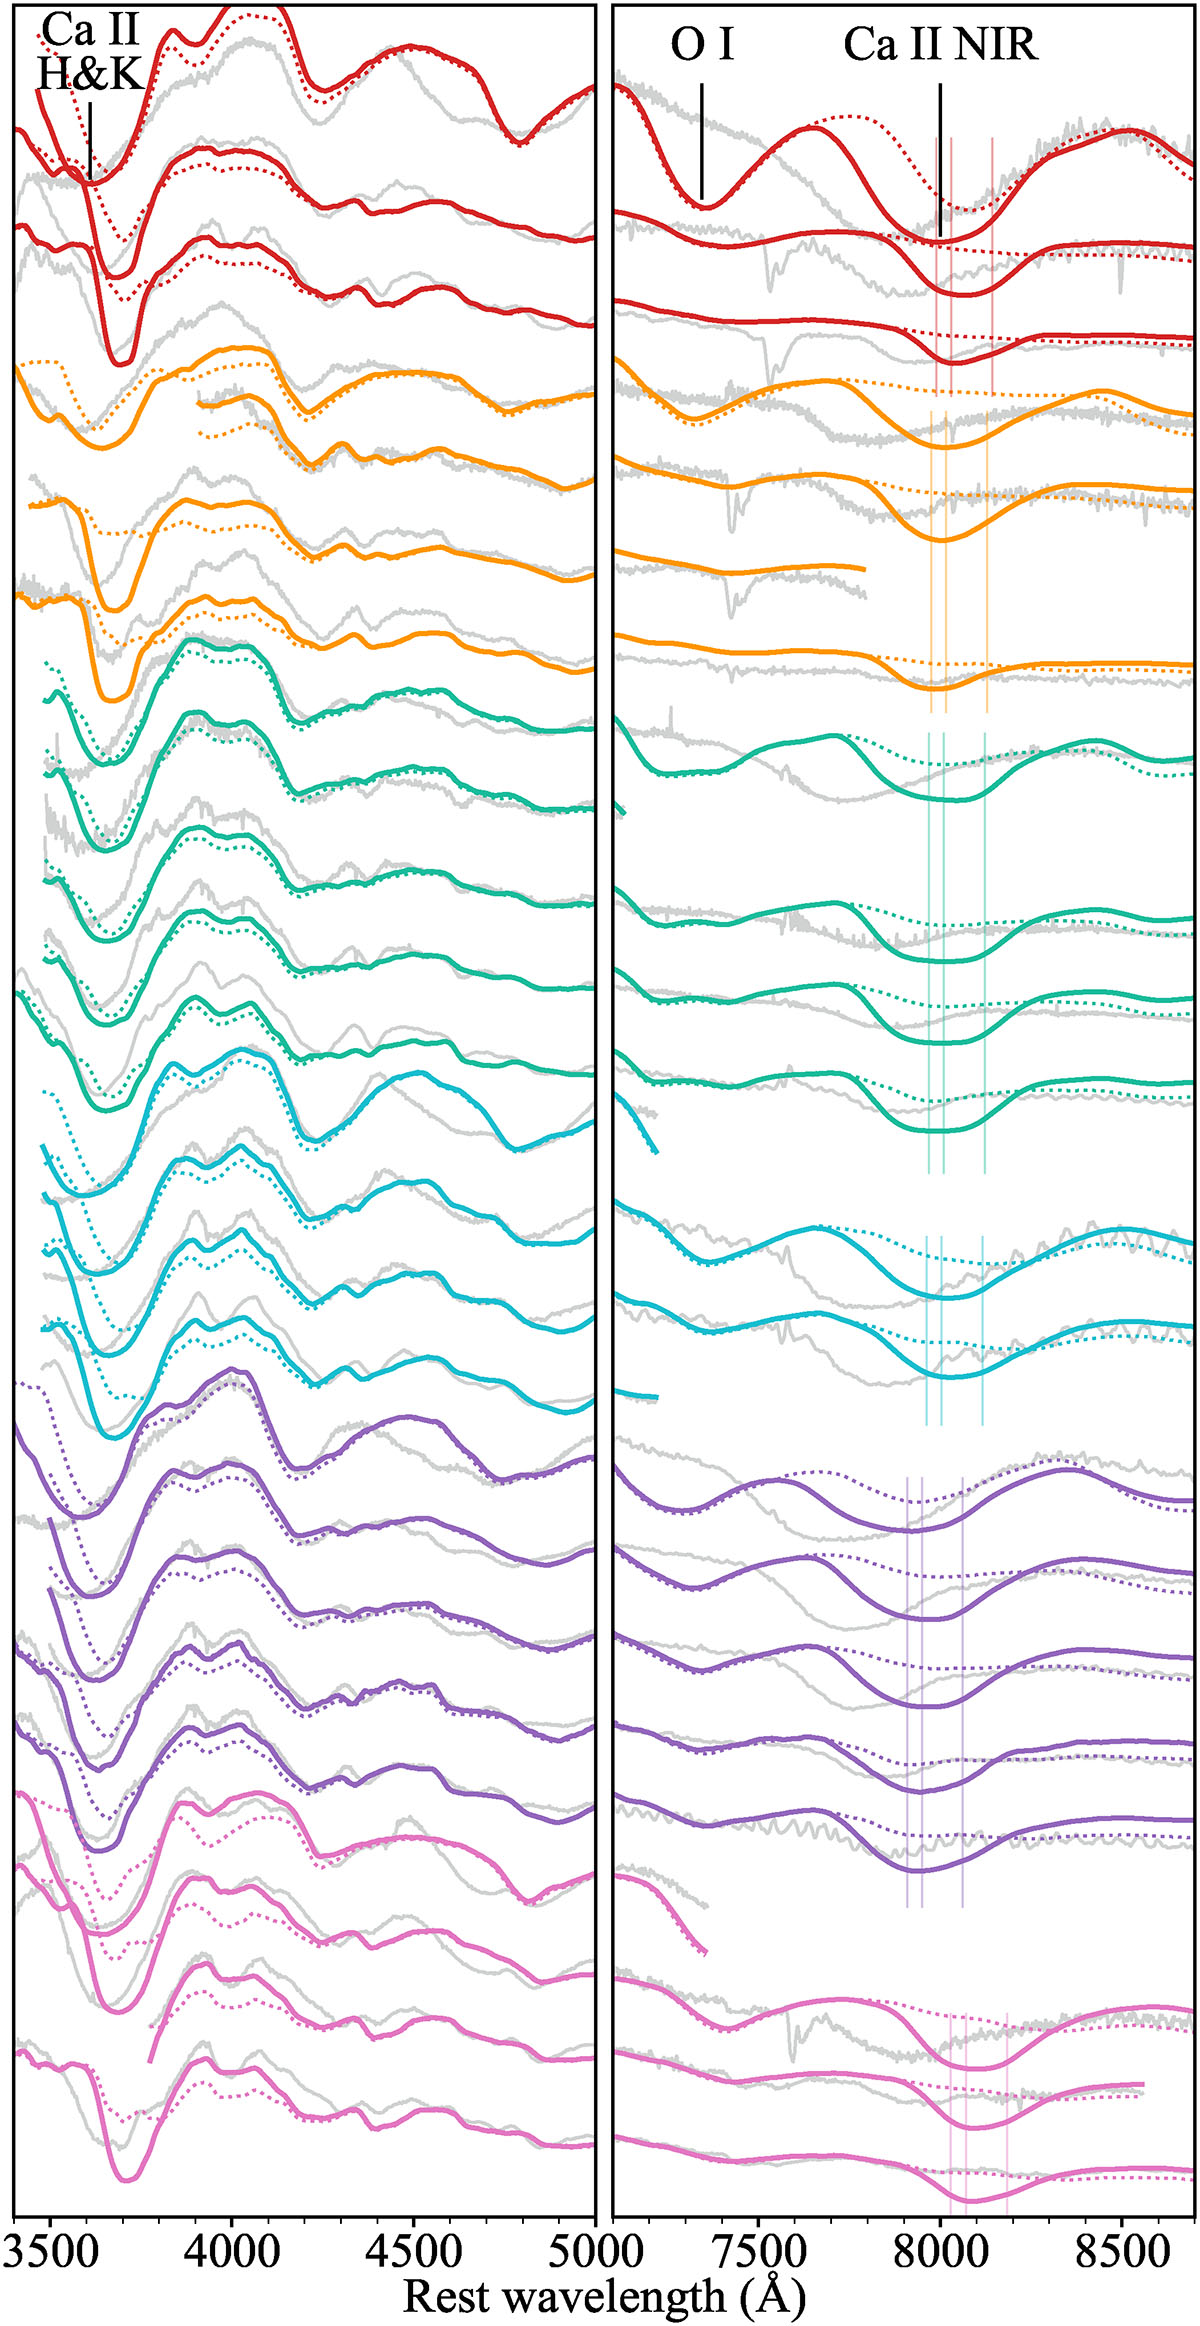
Ca II H&K and NIR features synthesised by the best-fitting density enhancement profiles with Ca abundances as defined in the PV models (dotted) and with 5% outer calcium (solid). The coloured vertical lines correspond to the NIR wavelengths at the inner velocity boundary of the outer ejecta shell.
Current usage metrics show cumulative count of Article Views (full-text article views including HTML views, PDF and ePub downloads, according to the available data) and Abstracts Views on Vision4Press platform.
Data correspond to usage on the plateform after 2015. The current usage metrics is available 48-96 hours after online publication and is updated daily on week days.
Initial download of the metrics may take a while.