Fig. 2.
Download original image
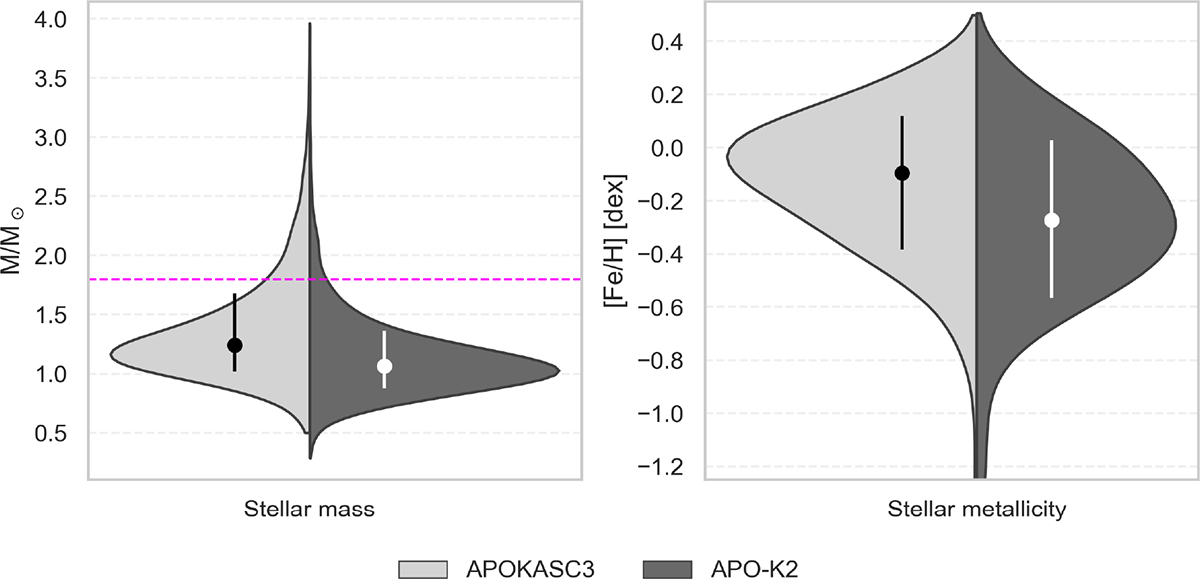
Normalized kernel density estimates of the distributions for the stellar mass (left) and metallicity (right) for the APOKASC 3 (light) APO-K2 (dark) samples. The dots and vertical bars mark the respective sample’s median and the interquartile range (25th–75th percentiles). The dashed magenta line indicates the mass threshold of 1.8 M⊙.
Current usage metrics show cumulative count of Article Views (full-text article views including HTML views, PDF and ePub downloads, according to the available data) and Abstracts Views on Vision4Press platform.
Data correspond to usage on the plateform after 2015. The current usage metrics is available 48-96 hours after online publication and is updated daily on week days.
Initial download of the metrics may take a while.