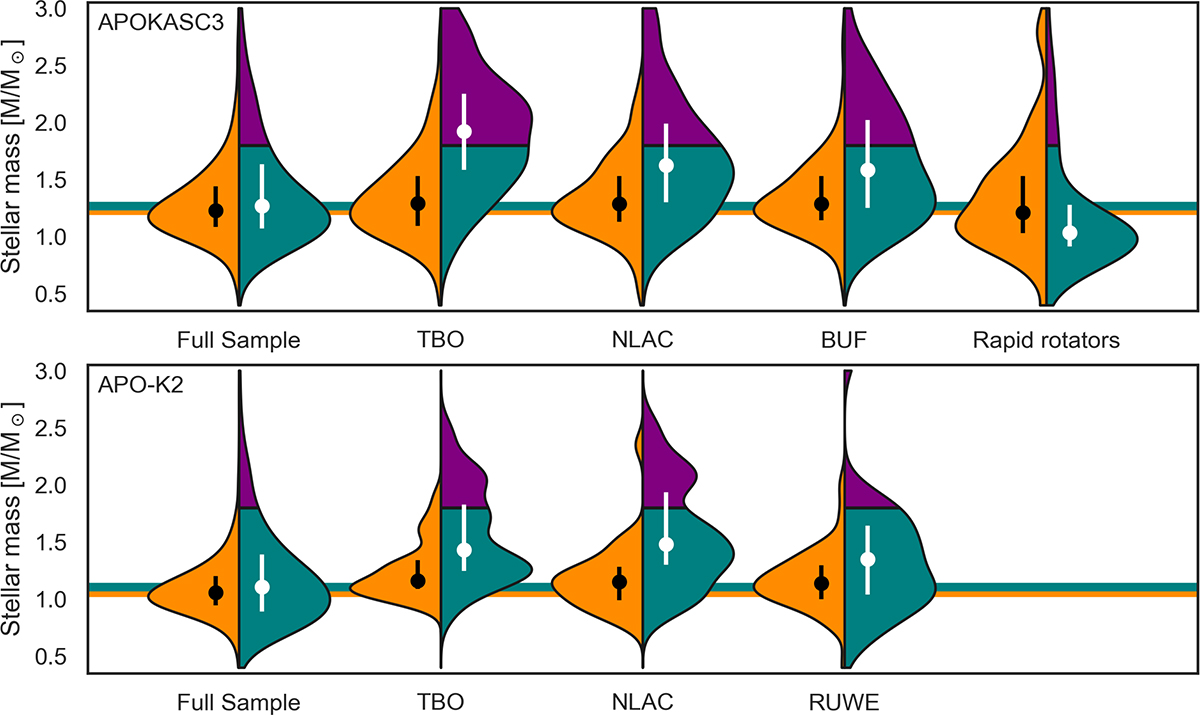
Fig. 4.
Download original image
Normalized kernel density estimates of the stellar mass distributions for red-giant stars in the APOKASC 3 (top) and APO-K2 (bottom) samples. Each KDE is split by evolutionary stage, with the left side (orange) showing RGB stars and the right side displaying core-helium burning stars. The latter are further divided into RC (teal) and 2RC (purple) stars, separated at 1.8 M⊙. Distributions are shown for the full sample and several binary candidate subsamples identified by the TBO, NLAC, and Binary Union Flag (BUF) for APOKASC 3 and RUWE for APO-K2, as well as the rapid rotator subset in APOKASC 3. Dots and vertical bars indicate the median and interquartile range (25th–75th percentiles) for each population. Horizontal orange and teal lines mark the median RGB and RC stellar masses of the respective full samples.
Current usage metrics show cumulative count of Article Views (full-text article views including HTML views, PDF and ePub downloads, according to the available data) and Abstracts Views on Vision4Press platform.
Data correspond to usage on the plateform after 2015. The current usage metrics is available 48-96 hours after online publication and is updated daily on week days.
Initial download of the metrics may take a while.