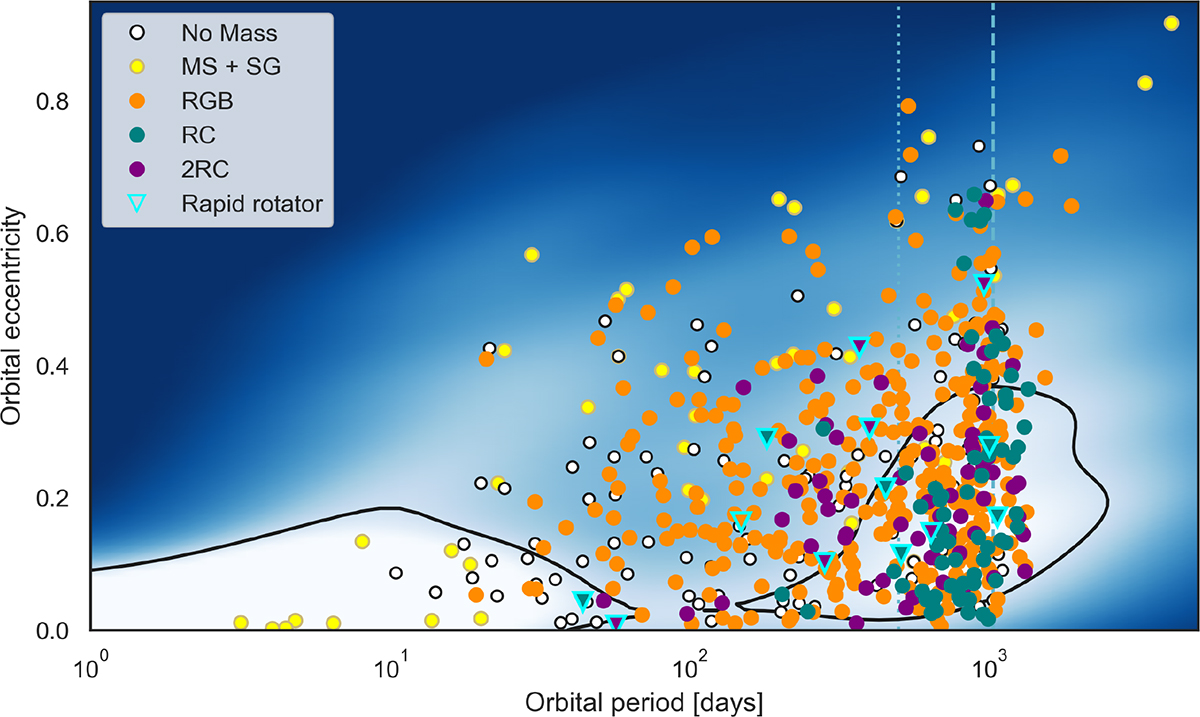
Fig. 5.
Download original image
Orbital parameters of binary systems with seismically inferred evolutionary states. In addition to the color code for the evolutionary states of red giants (Fig. 1), oscillating MS + SG primaries are shown in yellow. Stars found to be rapid rotators are marked as triangles. The background color map represents the KDE of the full SB9 catalog, with black lines outlining regions where the density exceeds seven times the median value. Vertical dashed and dotted lines represent the 1034 d timebase of Gaia DR3 and ∼500 d limit for RGB stars with degenerate cores to evolve as single stars. Likely artifact solutions for giants (Porb, TBO ≤ 10 days) are shown with a lower opacity.
Current usage metrics show cumulative count of Article Views (full-text article views including HTML views, PDF and ePub downloads, according to the available data) and Abstracts Views on Vision4Press platform.
Data correspond to usage on the plateform after 2015. The current usage metrics is available 48-96 hours after online publication and is updated daily on week days.
Initial download of the metrics may take a while.