Fig. 6.
Download original image
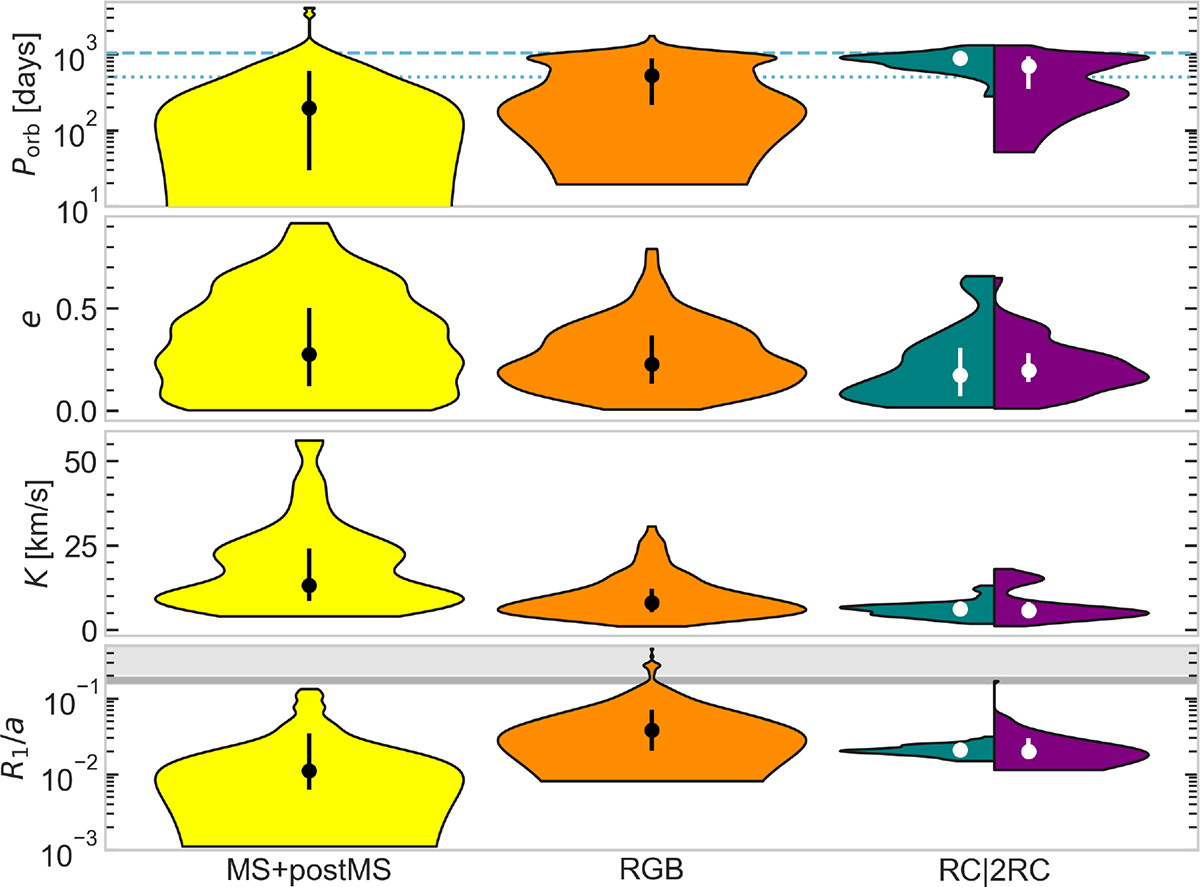
KDEs of orbital parameters (e, P), the RV semi-amplitude K, and fractional radius R1/a for the binary population identified by the Gaia TBO for solar-like oscillators. The distributions are grouped by evolutionary stage, with the rightmost violin in each panel split to show RC (teal) and 2RC (purple) stars. Dots and vertical bars indicate the median and interquartile range (25th–75th percentiles) of each group. Horizontal dashed and dotted lines in the top panel mark the Gaia DR3 time baseline (1034 d) and the ∼500 d upper limit for binary interaction during the RGB phase for stars with degenerate helium cores. The shaded gray region in the bottom panel marks the regime of strong tidal interaction (R1/a > 15%).
Current usage metrics show cumulative count of Article Views (full-text article views including HTML views, PDF and ePub downloads, according to the available data) and Abstracts Views on Vision4Press platform.
Data correspond to usage on the plateform after 2015. The current usage metrics is available 48-96 hours after online publication and is updated daily on week days.
Initial download of the metrics may take a while.