Fig. 8.
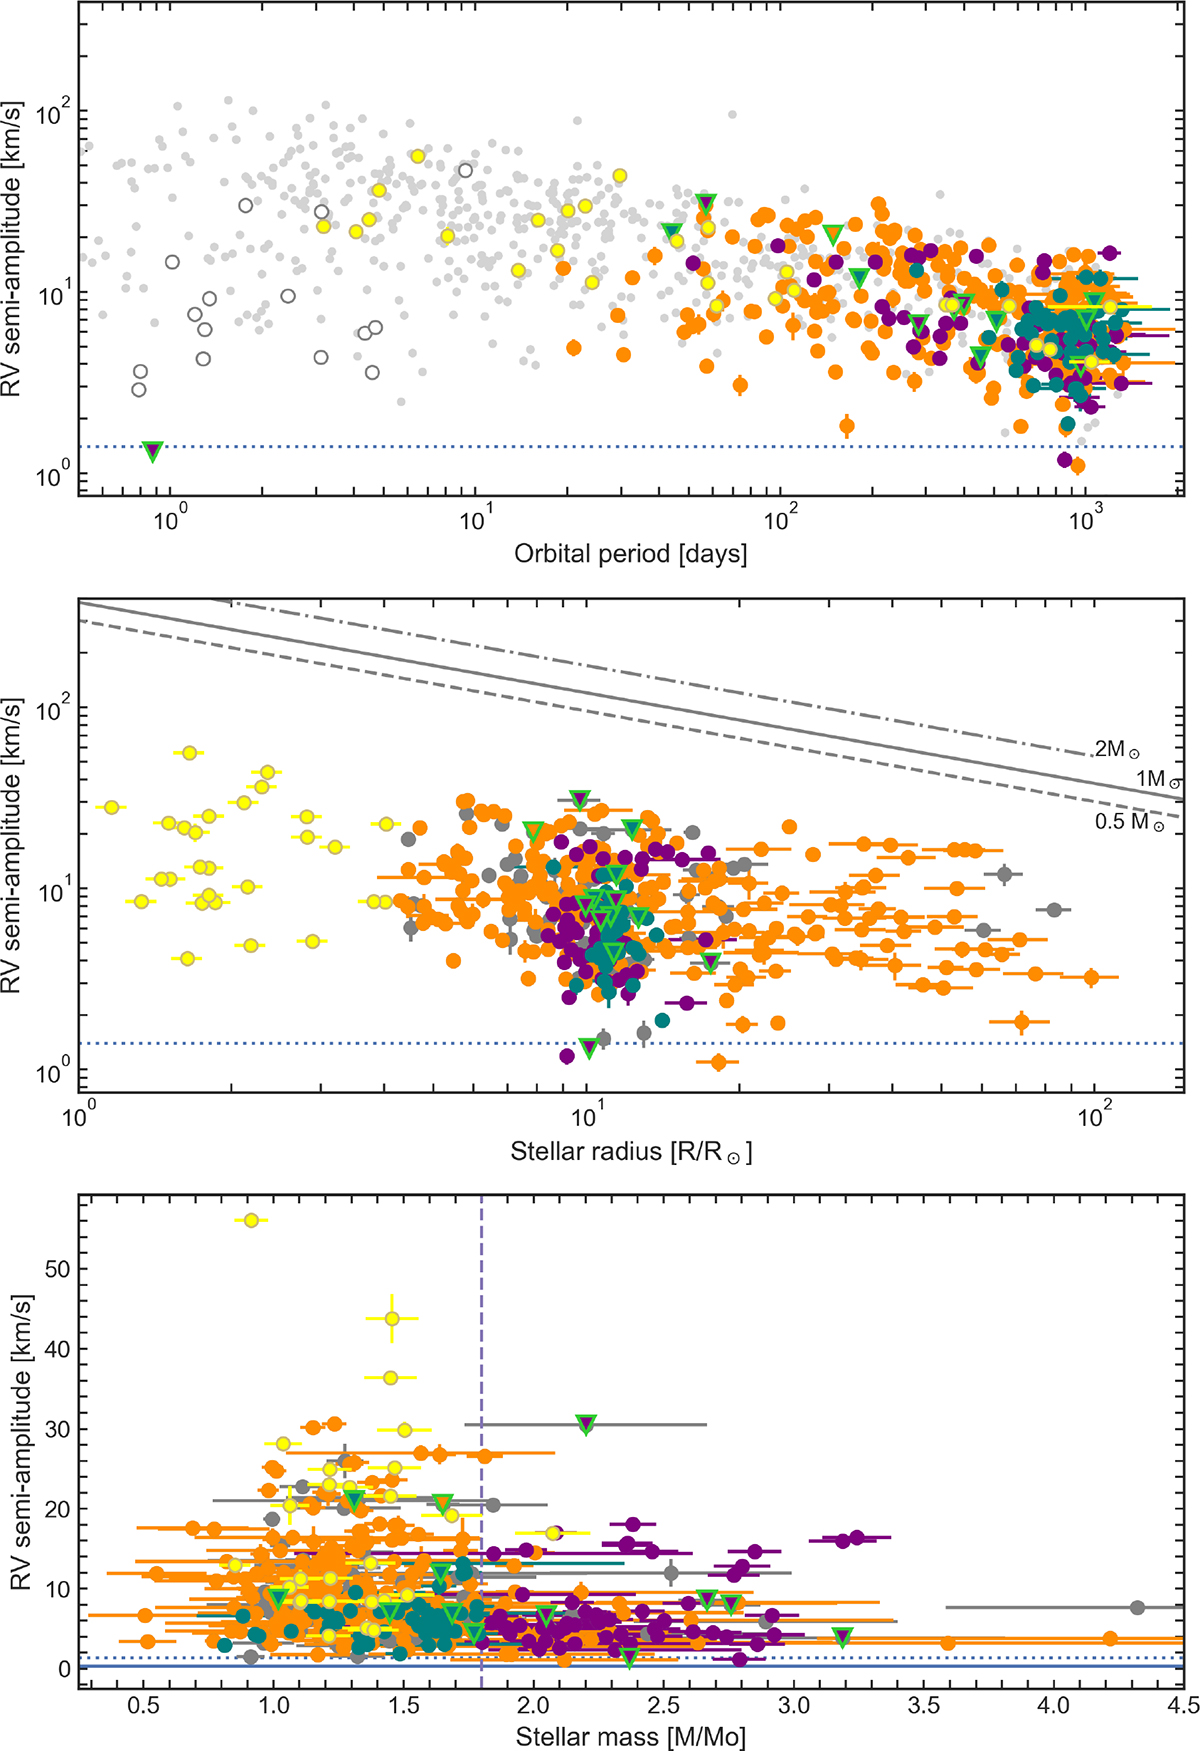
Download original image
Evolution of the RV semiamplitude of the binary motion as a function of the orbital period (top), stellar radius of the primary from Gaia parameters (middle), and the seismically inferred mass (bottom panel). The colors of the dots represent the various evolutionary states and are identical to Fig. 1. The dotted and solid horizontal lines in the top and bottom panels depict the detection threshold of the RVS instrument for faint (G ≤ 14 mag) and bright stars (G ≤ 12 mag), respectively. The gray lines in the middle panel depict the RV for binary systems whose Roche lobe radius is filled. The vertical purple line marks the chosen separation between RC and 2RC stars.
Current usage metrics show cumulative count of Article Views (full-text article views including HTML views, PDF and ePub downloads, according to the available data) and Abstracts Views on Vision4Press platform.
Data correspond to usage on the plateform after 2015. The current usage metrics is available 48-96 hours after online publication and is updated daily on week days.
Initial download of the metrics may take a while.