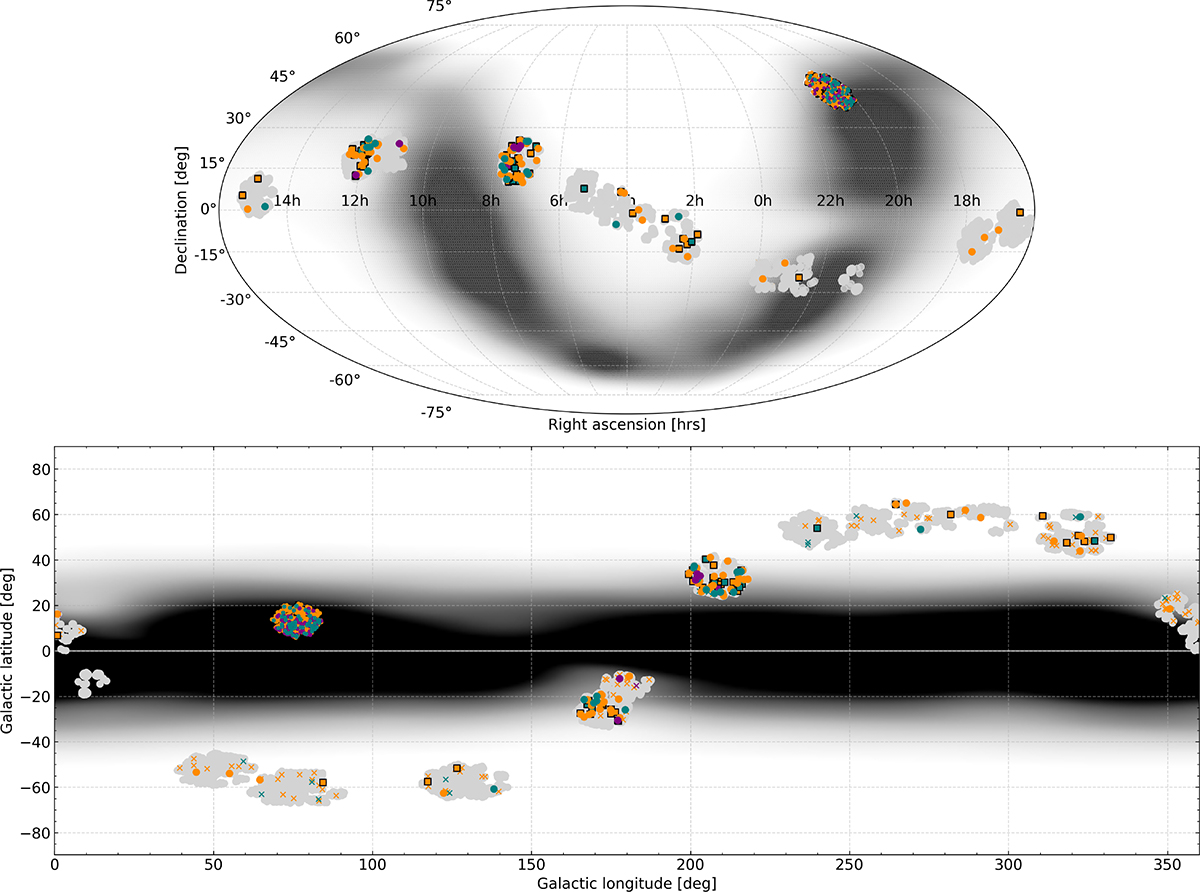
Fig. A.1.
Download original image
Position of the observed samples on the equatorial plane of the sky (top panel) as well as in galactic coordinates (bottom panel). Gray data points indicate the position of the individual targets in the catalog with detected oscillations. The K2 campaign (C) number is given. The shapes of the markers, representing various binary indicators, and their colors indicating seismically inferred evolutionary states are identical to those in Fig. 1. The color-shaded background depicts the distribution of all stars observed by Gaia with G ≤ 10 mag.
Current usage metrics show cumulative count of Article Views (full-text article views including HTML views, PDF and ePub downloads, according to the available data) and Abstracts Views on Vision4Press platform.
Data correspond to usage on the plateform after 2015. The current usage metrics is available 48-96 hours after online publication and is updated daily on week days.
Initial download of the metrics may take a while.