Fig. 11.
Download original image
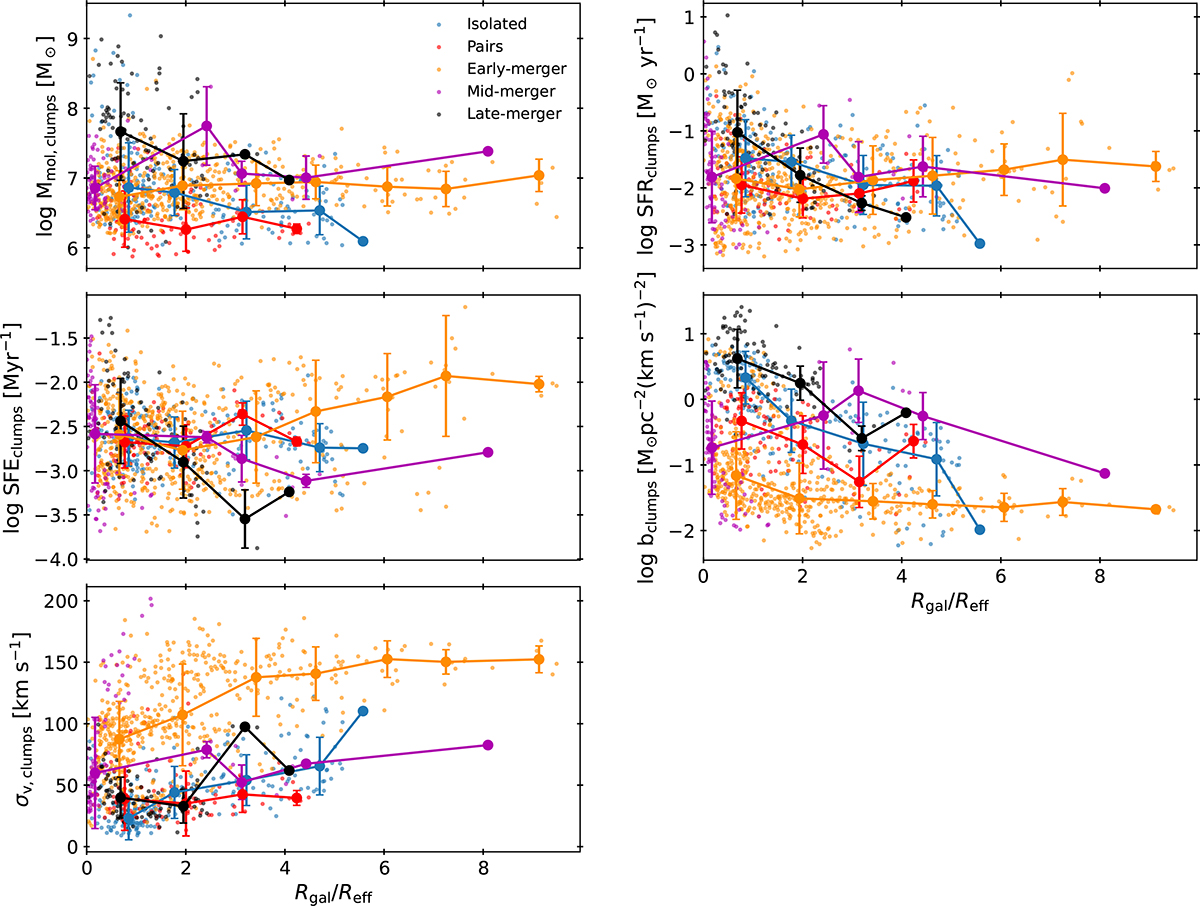
Molecular gas mass (top left), SFR (top right), SFE (middle left), boundedness of the gas (middle right), velocity dispersion (bottom left) of individual clumps as a function of galactocentric radius normalised by the CO(2–1) effective radius, Rgal/Reff, across the sample. The data points show the median values of Mmol, SFR, SFE, b and σv in bins of normalised galactocentric distance for each merger stage. The error bars indicate the mean absolute deviation of the points in the bins.
Current usage metrics show cumulative count of Article Views (full-text article views including HTML views, PDF and ePub downloads, according to the available data) and Abstracts Views on Vision4Press platform.
Data correspond to usage on the plateform after 2015. The current usage metrics is available 48-96 hours after online publication and is updated daily on week days.
Initial download of the metrics may take a while.