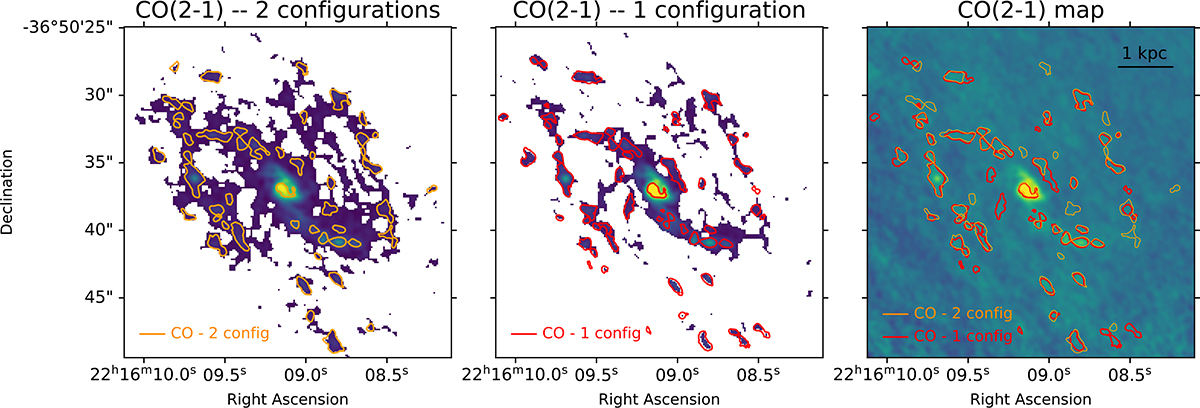
Fig. A.1.
Download original image
CO(2–1) integrated intensity maps of IC 5179 at ∼100 pc scales, obtained with ALMA using two configurations (left panel) and only one extended configuration (middle panel). These maps illustrate (orange and red contours) the identified regions from the dendrogram analysis detailed in Sect. 3.1.2, applied to each map based on the same criteria. The map without clipping (right panel) displays the clumps identified. from observations using both one and two configurations.
Current usage metrics show cumulative count of Article Views (full-text article views including HTML views, PDF and ePub downloads, according to the available data) and Abstracts Views on Vision4Press platform.
Data correspond to usage on the plateform after 2015. The current usage metrics is available 48-96 hours after online publication and is updated daily on week days.
Initial download of the metrics may take a while.