Fig. C.2.
Download original image
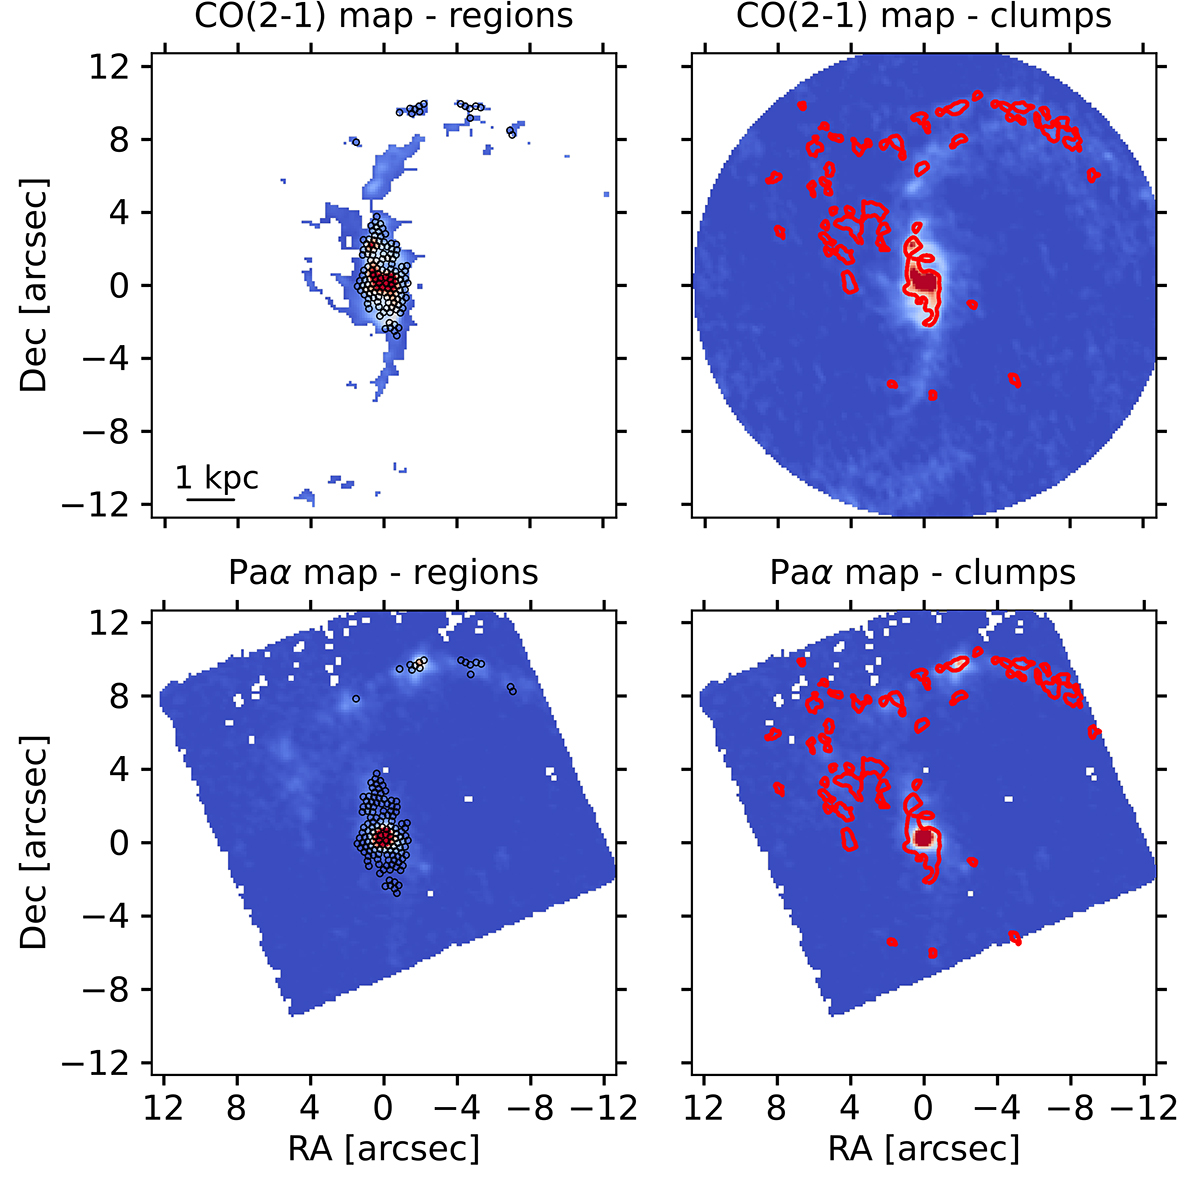
ALMA CO(2–1) integrated intensity (moment 0) map and HST Paα image of the galaxy NGC 7130. Left: Location of the beam-sized regions (in black) on the CO(2–1) (top) and Paα (bottom) maps. Right: Location of physical structures (in red) found using Astrodendro (clumps) on the CO(2–1) (top) map, also projected over the Paα (bottom) map. The regions and clumps are both detected with ALMA and HST.
Current usage metrics show cumulative count of Article Views (full-text article views including HTML views, PDF and ePub downloads, according to the available data) and Abstracts Views on Vision4Press platform.
Data correspond to usage on the plateform after 2015. The current usage metrics is available 48-96 hours after online publication and is updated daily on week days.
Initial download of the metrics may take a while.