Open Access
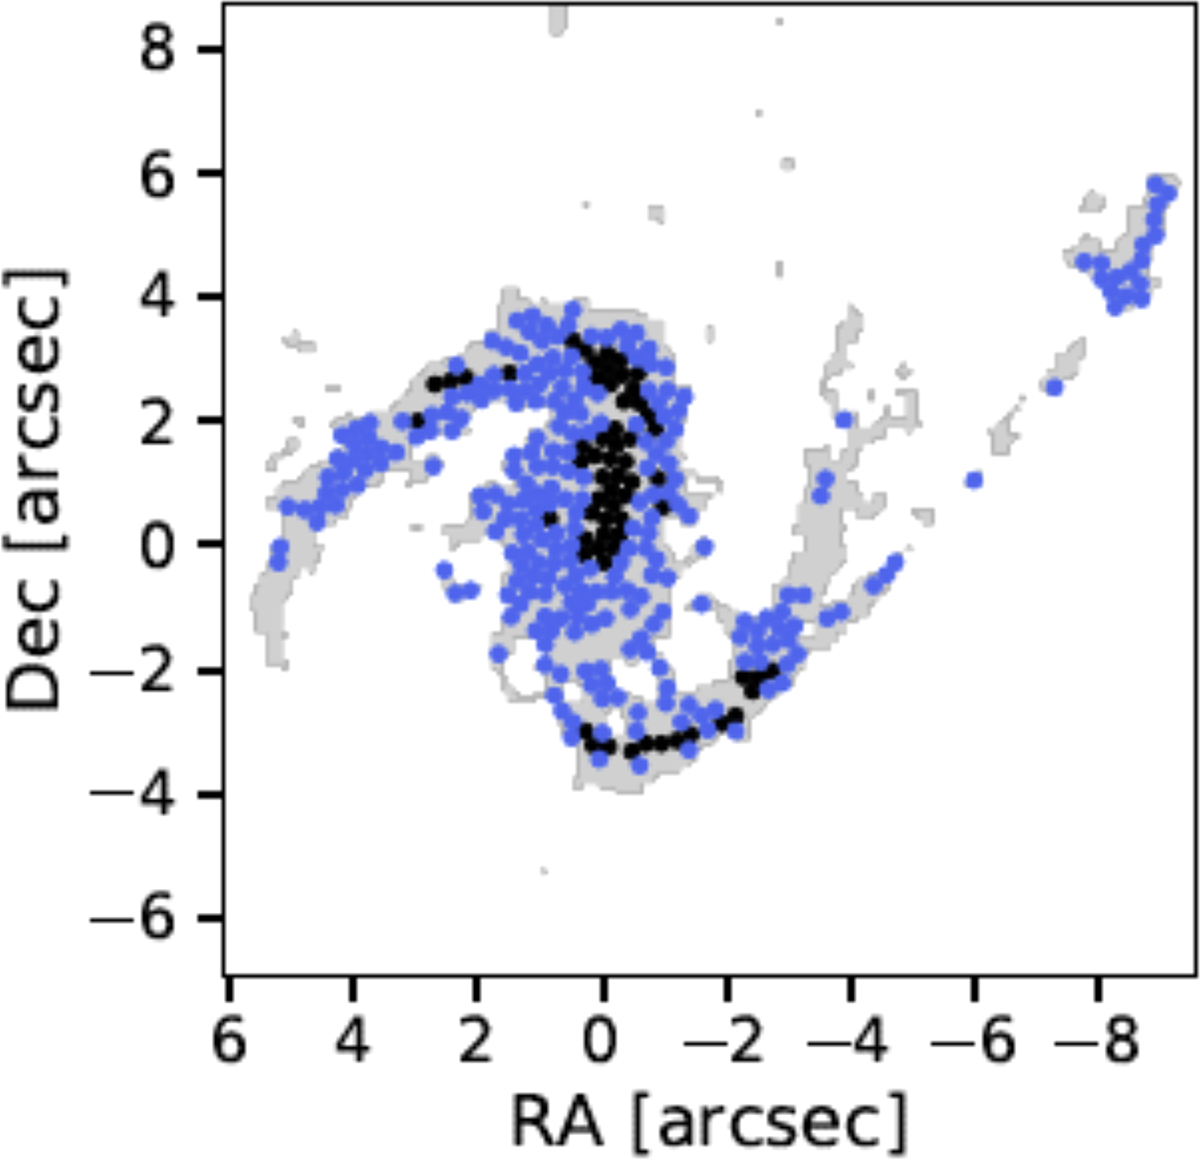
Fig. E.1.
Download original image
Location of the regions on the CO(2–1) map (grey) for NGC 3110. The black and blue points indicate regions corresponding to the two branches of the KS relation shown in Fig. 5: blue points correspond to higher ΣH2 and ΣSFR, while black points correspond to lower ΣH2 and ΣSFR.
Current usage metrics show cumulative count of Article Views (full-text article views including HTML views, PDF and ePub downloads, according to the available data) and Abstracts Views on Vision4Press platform.
Data correspond to usage on the plateform after 2015. The current usage metrics is available 48-96 hours after online publication and is updated daily on week days.
Initial download of the metrics may take a while.