Open Access
Fig. E.2.
Download original image
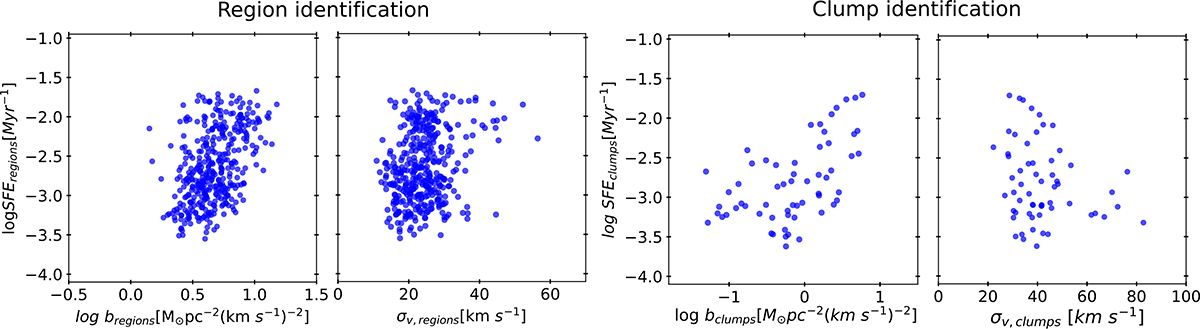
Scatter plots for NGC 7469 showing the star formation efficiency (SFE) as a function of the boundedness parameter (b), and of the velocity dispersion (σv). From left to right, the panels show SFE vs b and SFE vs σv for beam-sized regions, followed by SFE vs b and SFE vs σv for clump identification.
Current usage metrics show cumulative count of Article Views (full-text article views including HTML views, PDF and ePub downloads, according to the available data) and Abstracts Views on Vision4Press platform.
Data correspond to usage on the plateform after 2015. The current usage metrics is available 48-96 hours after online publication and is updated daily on week days.
Initial download of the metrics may take a while.