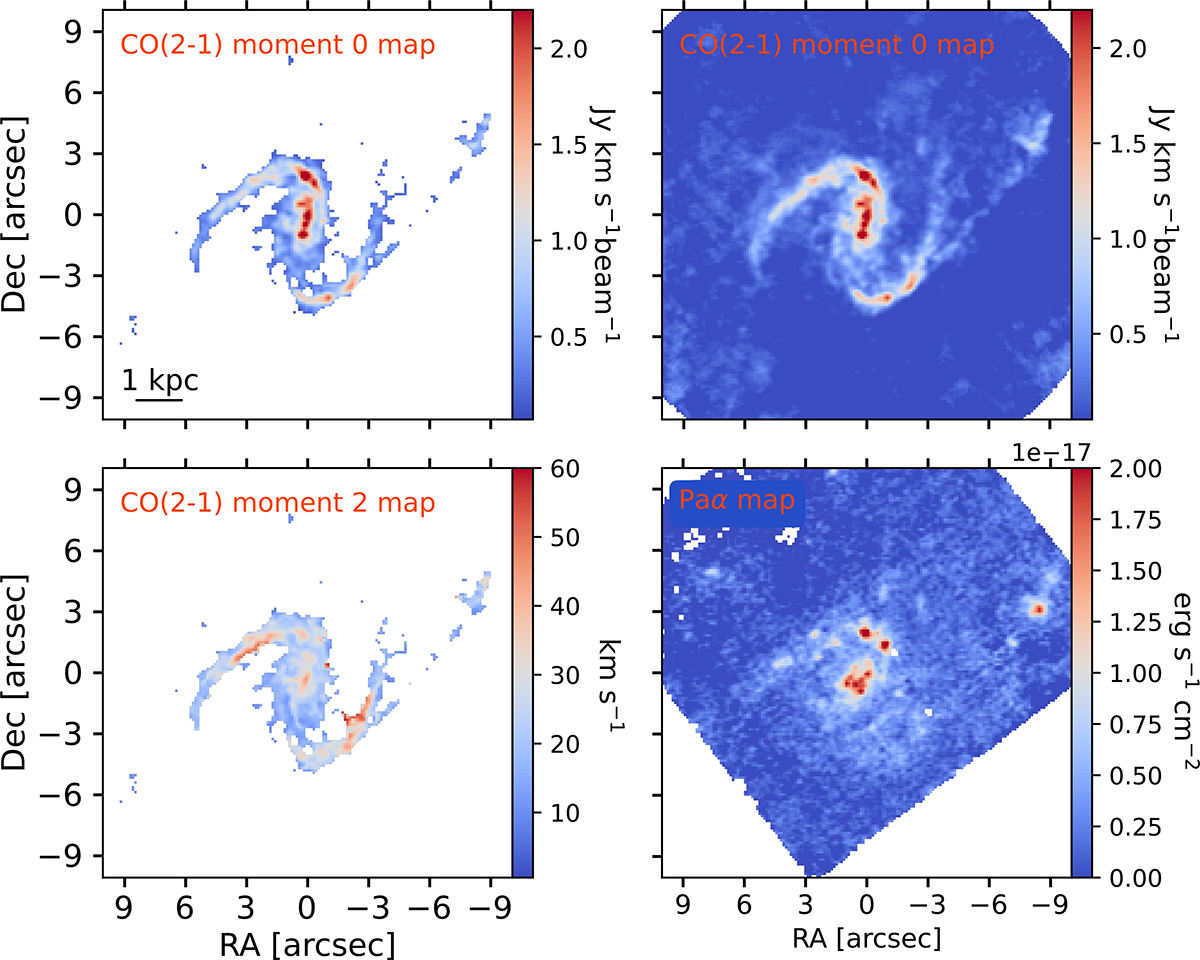
Fig. 2.
Download original image
ALMA CO(2–1) integrated intensity (moment 0) maps, with pixel masking applied to the data cube (top left panel) and without it (top right panel), CO(2–1) velocity dispersion (moment 2) map (bottom left panel) and the HST Paα image (bottom right panel) of the galaxy NGC 3110 at ∼100 pc scale. At this scale, significant differences are observed between the CO(2–1) moment 0 and Paα maps, revealing emission structures distributed throughout the galaxy.
Current usage metrics show cumulative count of Article Views (full-text article views including HTML views, PDF and ePub downloads, according to the available data) and Abstracts Views on Vision4Press platform.
Data correspond to usage on the plateform after 2015. The current usage metrics is available 48-96 hours after online publication and is updated daily on week days.
Initial download of the metrics may take a while.