Fig. E.5.
Download original image
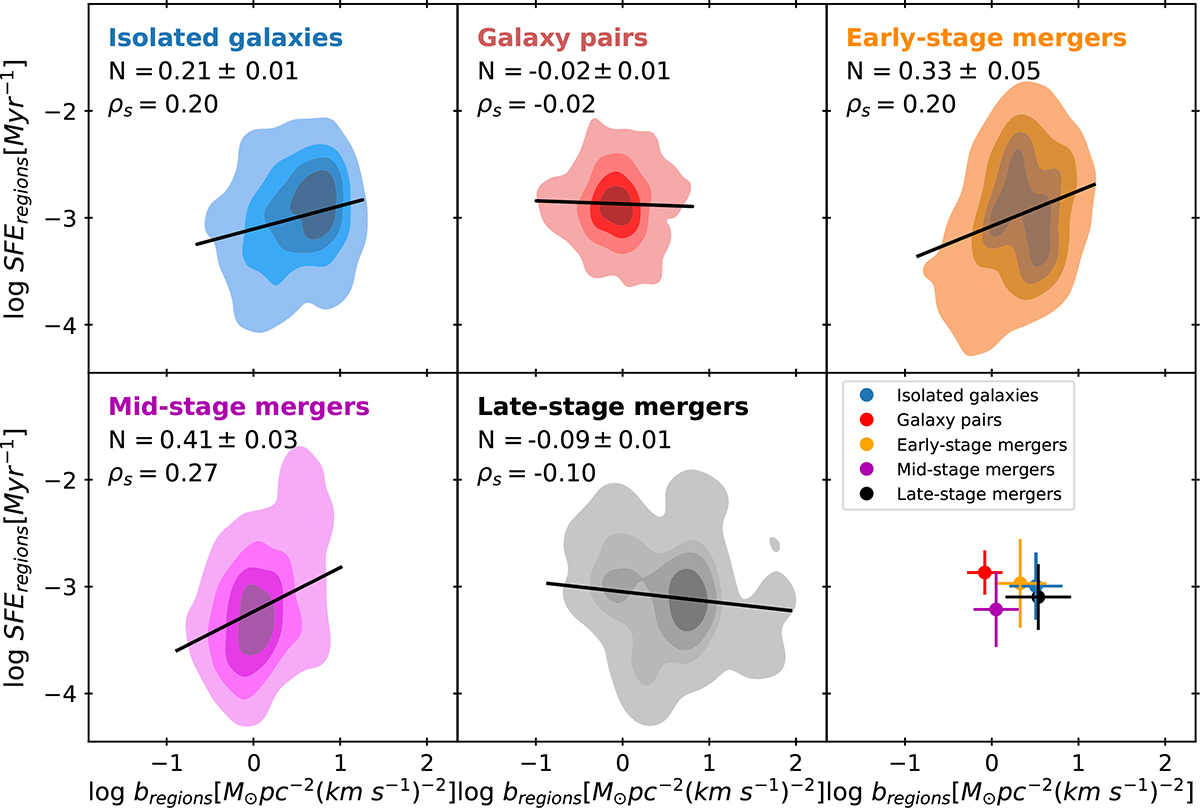
SF efficiency (SFE) as a function of the boundedness of the regions (parameter bregions) across the merger sequence. From left to right and top to bottom, the merger stages are isolated galaxies (blue), galaxy pairs (red), early-stage mergers (orange), mid-stage mergers (magenta), and late-stage mergers (black). The Spearman’s rank correlation coefficients (ρs) and the power-law indices (N) of the best-fit relations are indicated. The bottom right panel shows the mean values of log10SFEregions and log10bregions; the error bars represent the mean absolute deviation for each merger stage.
Current usage metrics show cumulative count of Article Views (full-text article views including HTML views, PDF and ePub downloads, according to the available data) and Abstracts Views on Vision4Press platform.
Data correspond to usage on the plateform after 2015. The current usage metrics is available 48-96 hours after online publication and is updated daily on week days.
Initial download of the metrics may take a while.