Fig. E.7.
Download original image
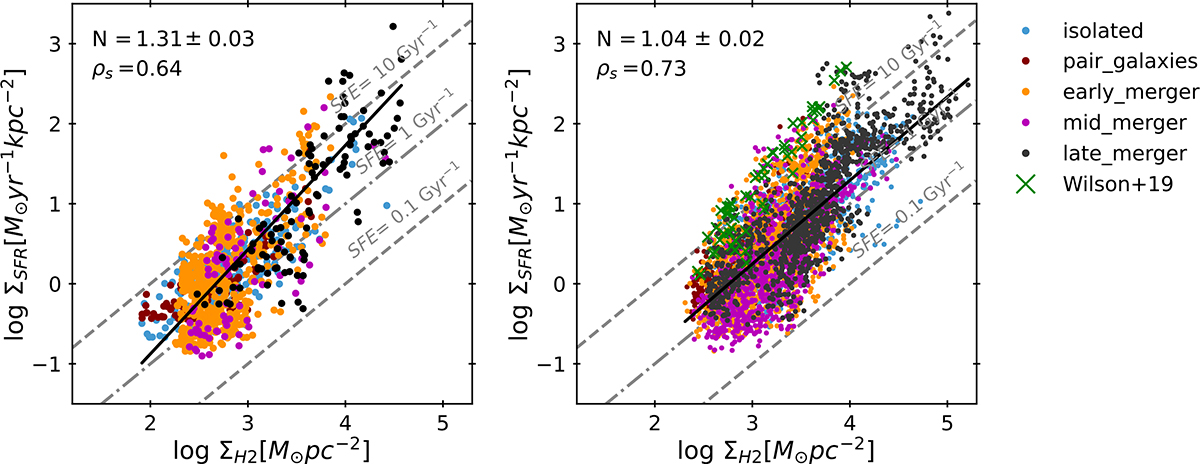
KS relations for clumps (left) and regions (right) in our sample. Clumps show a superlinear trend, whereas regions yield a nearly linear relation. Data from the U/LIRG study of Wilson et al. (2019) are shown in green. The different colours correspond to the merger stages of the galaxies: isolated (blue), pairs (red), early-stage mergers (orange), mid-stage mergers (magenta), and late-stage mergers (black). The Spearman’s rank correlation coefficients (ρs) and the power-law indices (N) of the best-fit relations, derived from our sample, are indicated.
Current usage metrics show cumulative count of Article Views (full-text article views including HTML views, PDF and ePub downloads, according to the available data) and Abstracts Views on Vision4Press platform.
Data correspond to usage on the plateform after 2015. The current usage metrics is available 48-96 hours after online publication and is updated daily on week days.
Initial download of the metrics may take a while.