Fig. E.9.
Download original image
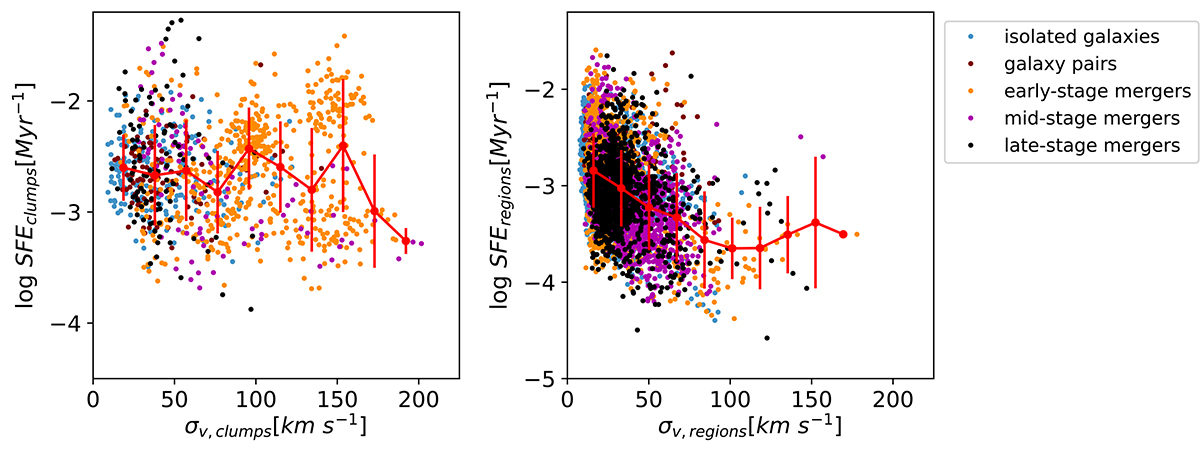
SF efficiency as a function of the velocity dispersion, shown for clumps (left) and regions (right) in our sample. Clumps exhibit a flat relation, while regions show a weak anti-correlation with increasing velocity dispersion. Considering the full sample, the scatter is large. Colours indicate the merger stage of the galaxies: isolated (blue), pairs (red), early-stage mergers (orange), mid-stage mergers (magenta), and late-stage mergers (black).
Current usage metrics show cumulative count of Article Views (full-text article views including HTML views, PDF and ePub downloads, according to the available data) and Abstracts Views on Vision4Press platform.
Data correspond to usage on the plateform after 2015. The current usage metrics is available 48-96 hours after online publication and is updated daily on week days.
Initial download of the metrics may take a while.