Fig. 5.
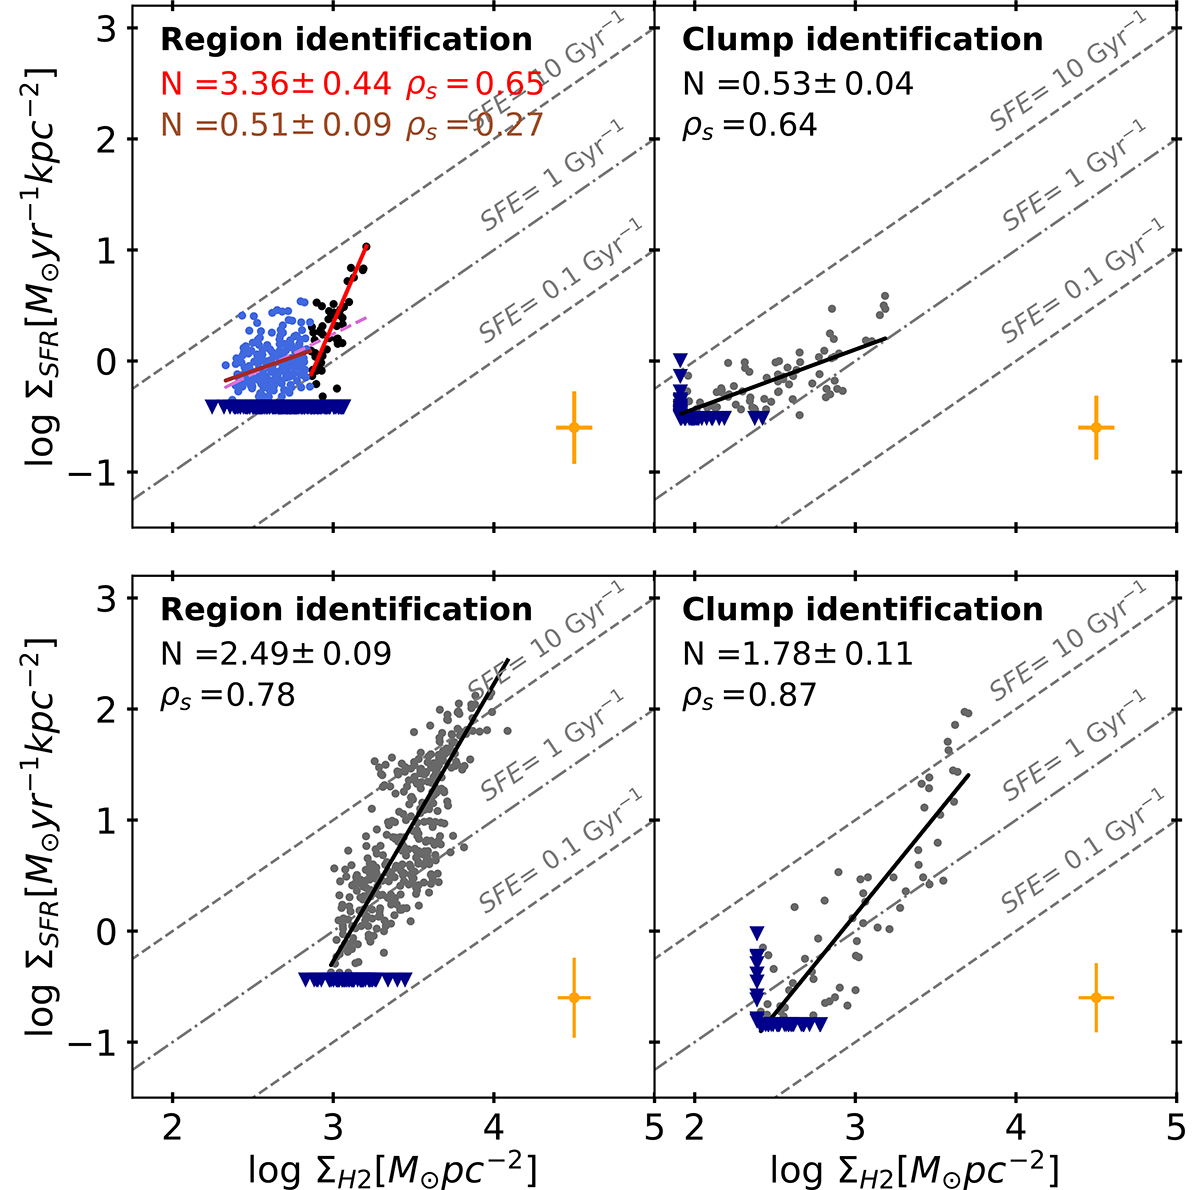
Download original image
SFR surface density (ΣSFR) as a function of the molecular gas surface density (ΣH2) is shown using beam-sized regions (left) and clumps identified with Astrodendro (right) for NGC 3110 (top) and NGC 7469 (bottom). The blue and black points represent the two branches derived by applying the MARS method with breaking points in the log ΣH2 for NGC3110 in the case of regions. The dark grey points correspond to the clump-based for both galaxies and the region-based method for NGC 7469. The brown and red solid lines are the best fits for the two branches, while the black line represents a one-slope fit. The Spearman’s rank correlation coefficients (ρs) and the power-law indices (N) of the derived best-fit KS relations are in the top left corner of each panel. The error bars indicate the mean systematic uncertainties in ΣH2 of ±0.11 (0.10) dex (horizontal) and the extinction correction in ΣSFR of ±0.27 (0.29) dex (vertical) for NGC 3110 (NGC 7469). The inverted triangles indicate upper limits. The grey dashed lines mark constant star formation efficiencies (SFE = ΣSFR/ΣH2).
Current usage metrics show cumulative count of Article Views (full-text article views including HTML views, PDF and ePub downloads, according to the available data) and Abstracts Views on Vision4Press platform.
Data correspond to usage on the plateform after 2015. The current usage metrics is available 48-96 hours after online publication and is updated daily on week days.
Initial download of the metrics may take a while.