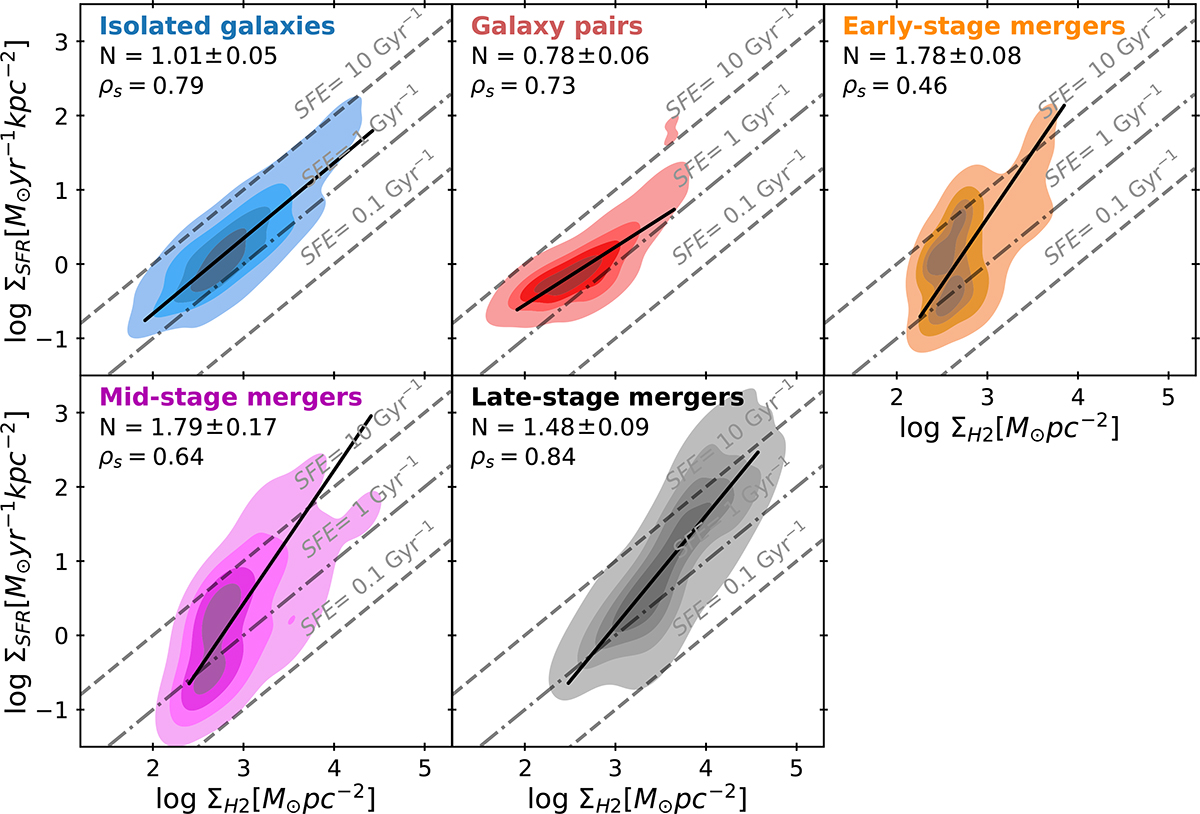
Fig. 7.
Download original image
KS diagram as a function of galaxy merger stage based on clump identification. From left to right and top to bottom, the merger stages are isolated galaxies (blue), galaxy pairs (red), early-stage mergers (orange), mid-stage mergers (magenta), and late-stage mergers (black). The black solid line represents the best fit for each dataset. The Spearman’s rank correlation coefficients (ρs) and the power-law indices (N) of the derived best-fit KS relations is at the top left of each panel. The grey dashed lines mark constant star formation efficiencies (SFE = ΣSFR/ΣH2).
Current usage metrics show cumulative count of Article Views (full-text article views including HTML views, PDF and ePub downloads, according to the available data) and Abstracts Views on Vision4Press platform.
Data correspond to usage on the plateform after 2015. The current usage metrics is available 48-96 hours after online publication and is updated daily on week days.
Initial download of the metrics may take a while.