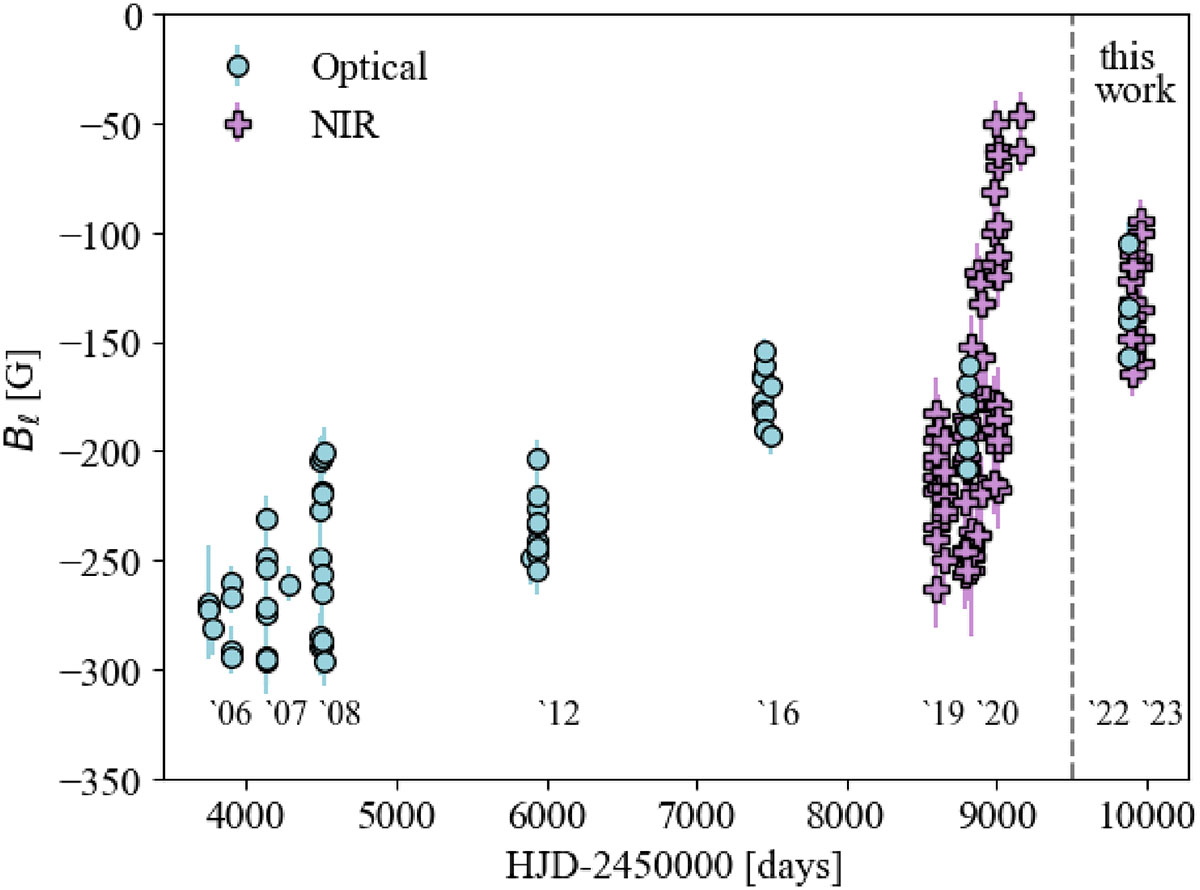
Fig. 2.
Download original image
Temporal evolution of the longitudinal magnetic field (Bℓ) from 2006 to 2023, using observations from ESPaDOnS, Narval, and SPIRou. Bℓ and HJD measurements prior to 2023 were sourced from Morin et al. (2008), Lavail et al. (2018), and Bellotti et al. (2023). The blue circles represent observations made in the optical domain, meanwhile the pink pluses represent near-infrared observations. The text below the data points roughly indicates the year of the observations.
Current usage metrics show cumulative count of Article Views (full-text article views including HTML views, PDF and ePub downloads, according to the available data) and Abstracts Views on Vision4Press platform.
Data correspond to usage on the plateform after 2015. The current usage metrics is available 48-96 hours after online publication and is updated daily on week days.
Initial download of the metrics may take a while.