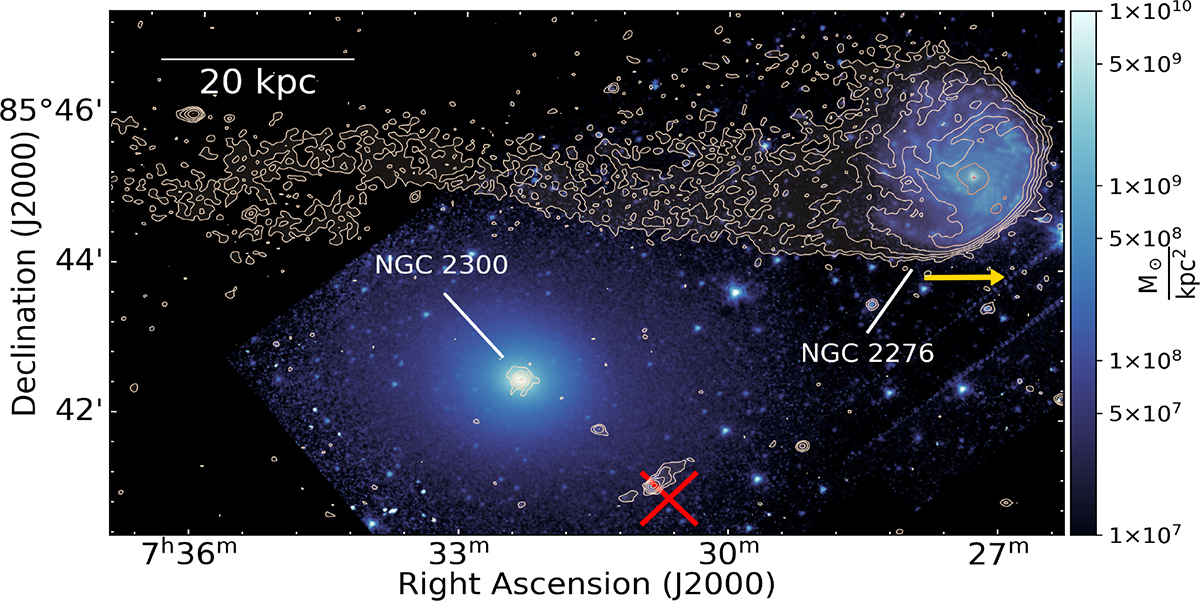
Fig. 1.
Download original image
Stellar mass surface density map of the center of NGC 2300 group obtained by combining Spitzer’s IRAC 1 and IRAC 2 images using stellar mass relation from Querejeta et al. (2015). Red cross shows the group X-ray IGM emission center from Mulchaey et al. (1993). LOFAR contours of the radio continuum emission (Roberts et al. 2024) at 144 MHz (3, 6, 12, 24, 48, 96, 192–RMS, RMS = 60 μJy, and resolution = 4.9 × 4.3 arcsec2) shown overplotted in white. Golden arrow shows the predicted trajectory of NGC 2276, derived from the direction of the radio continuum tail (Souchereau et al. 2025), along with the Hα kinematics (Haan & Braun 2014).
Current usage metrics show cumulative count of Article Views (full-text article views including HTML views, PDF and ePub downloads, according to the available data) and Abstracts Views on Vision4Press platform.
Data correspond to usage on the plateform after 2015. The current usage metrics is available 48-96 hours after online publication and is updated daily on week days.
Initial download of the metrics may take a while.