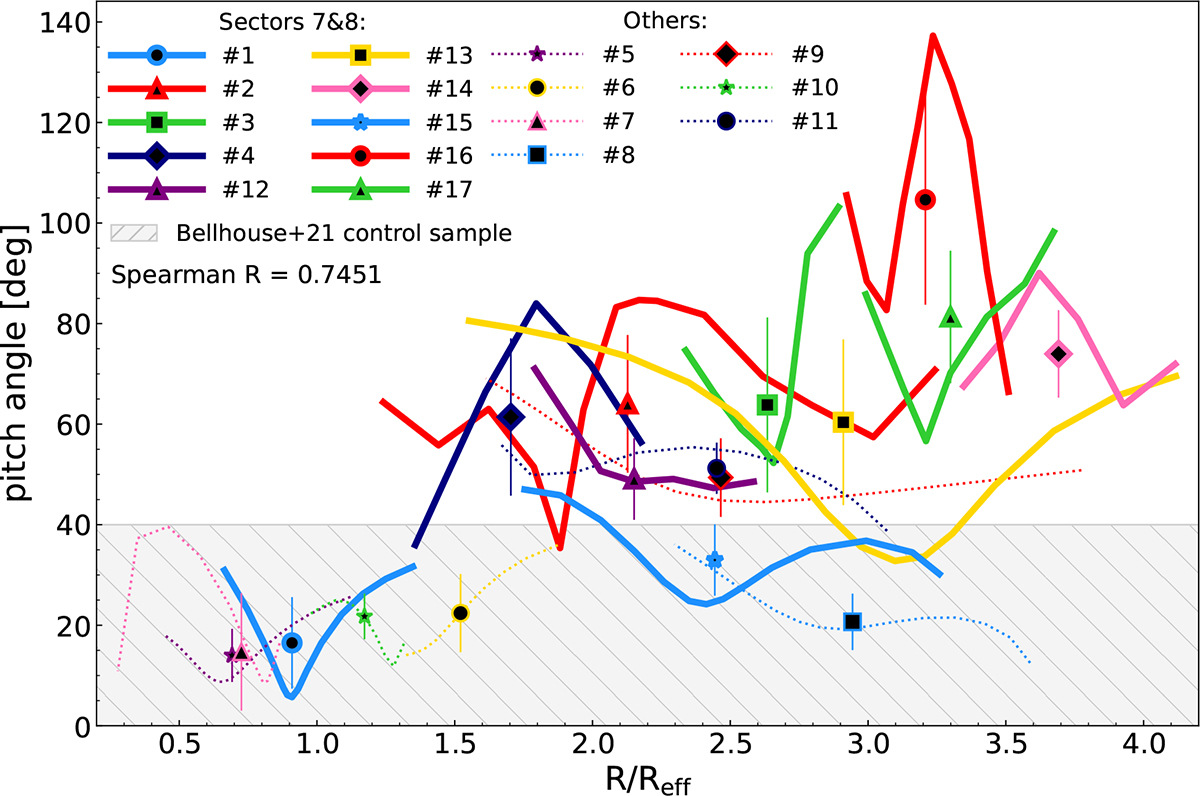
Fig. 10.
Download original image
Pitch angles for the 17 overdensity features found in NGC 2276. Bold and solid lines represent overdensity features in sectors 7 and 8, while the thin and dotted lines represent all the others. The points show the median value of the pitch angle in each of the overdensity features, and the error bars represent the standard deviation. Shaded area shows the highest pitch angle values for the sample of undisturbed galaxies from Bellhouse et al. (2021).
Current usage metrics show cumulative count of Article Views (full-text article views including HTML views, PDF and ePub downloads, according to the available data) and Abstracts Views on Vision4Press platform.
Data correspond to usage on the plateform after 2015. The current usage metrics is available 48-96 hours after online publication and is updated daily on week days.
Initial download of the metrics may take a while.