Fig. 1.
Download original image
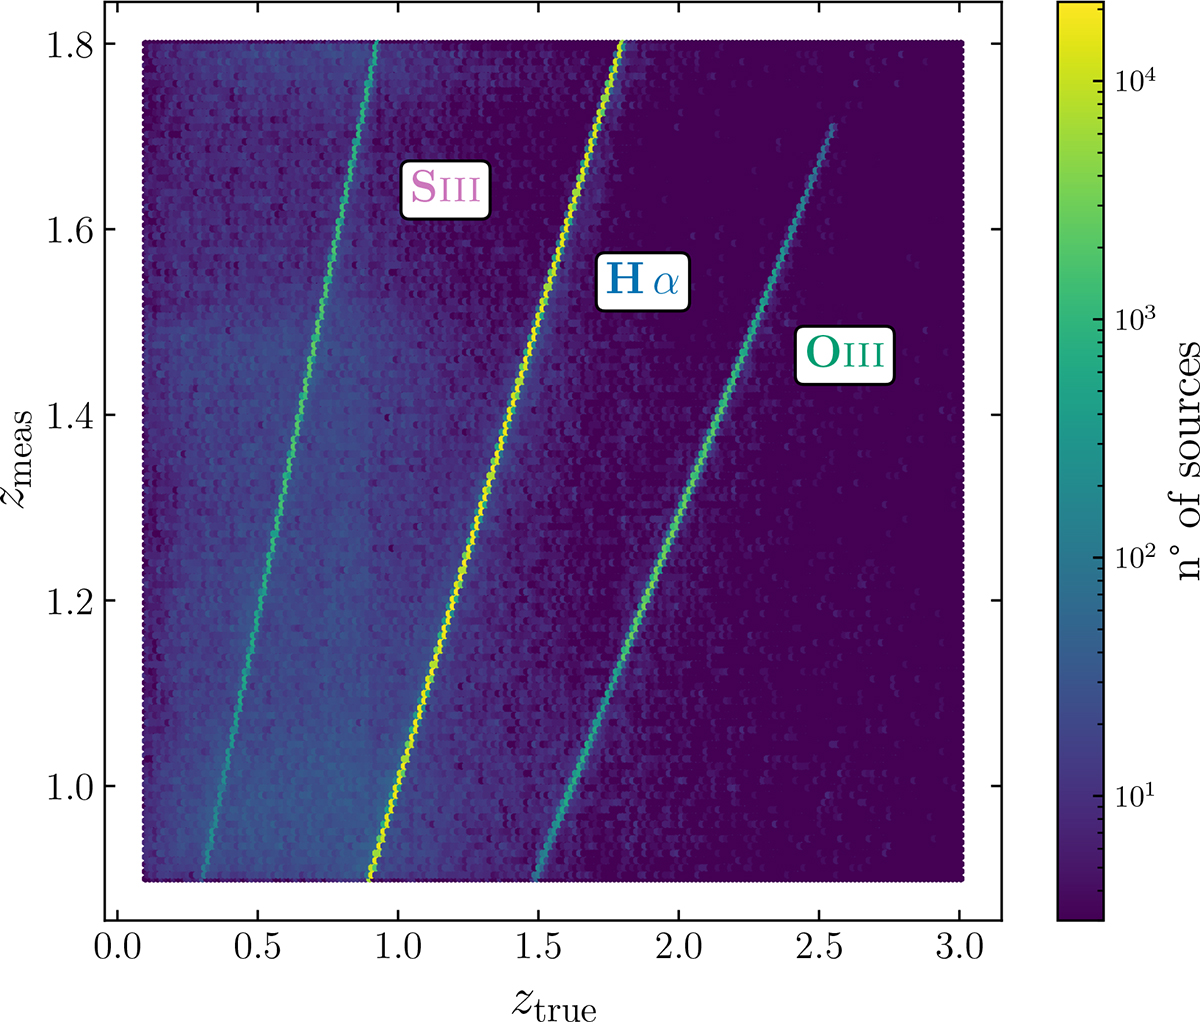
Representation of interloper galaxies in the (ztrue, zmeas) plane, representative of the Euclid spectroscopic selection. The extent of the vertical axis corresponds to the baseline observed redshift range used for the spectroscopic analysis. The plot refers to one of the EuclidLargeMocks (see Euclid Collaboration: Monaco et al. 2025, and Sect. 4.1).
Current usage metrics show cumulative count of Article Views (full-text article views including HTML views, PDF and ePub downloads, according to the available data) and Abstracts Views on Vision4Press platform.
Data correspond to usage on the plateform after 2015. The current usage metrics is available 48-96 hours after online publication and is updated daily on week days.
Initial download of the metrics may take a while.