Open Access
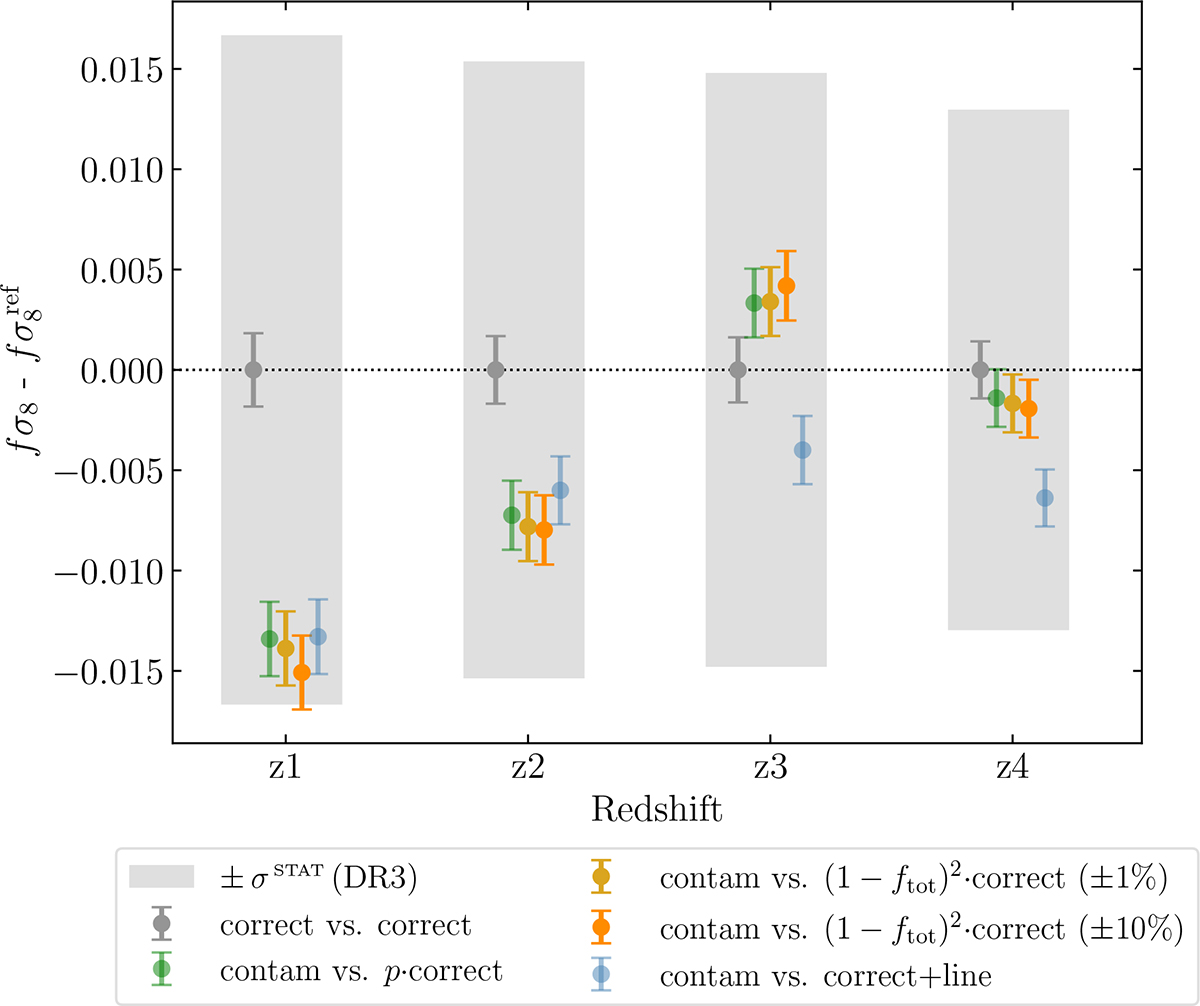
Fig. 13.
Download original image
Systematic bias on fσ8 of all tests with respect to the reference case. The grey bands represent an estimate of the precision on fσ8 at the end of the mission (DR3), when the observed volume will be six times bigger than DR1. As in Fig. 11, the error bars were derived using the errors on the mean values of the inferred fσ8.
Current usage metrics show cumulative count of Article Views (full-text article views including HTML views, PDF and ePub downloads, according to the available data) and Abstracts Views on Vision4Press platform.
Data correspond to usage on the plateform after 2015. The current usage metrics is available 48-96 hours after online publication and is updated daily on week days.
Initial download of the metrics may take a while.