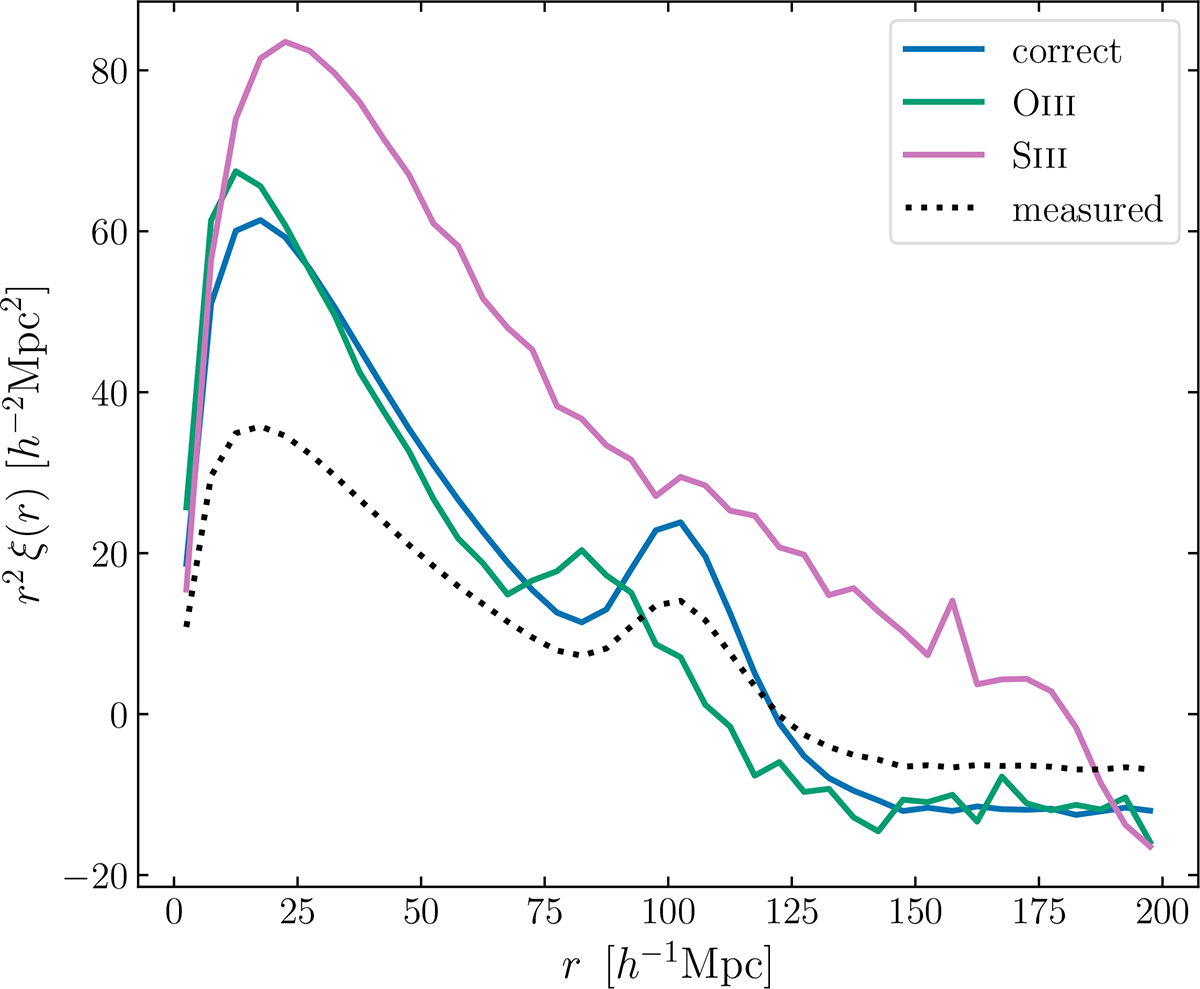
Fig. 2.
Download original image
Monopole of the contaminated sample auto-correlation (dashed black line) compared to the intrinsic correct galaxy (blue line) and line interloper (green and pink line) auto-correlations, not weighted by the prefactors in Eq. (17). The 2PCF are averaged over the EuclidLargeMocks in z ∈ [1.3, 1.5]. We can appreciate both the dilution of the clustering amplitude in the presence of contamination and the distortion of the line interlopers’ signal, in particular the shift of the BAO peak.
Current usage metrics show cumulative count of Article Views (full-text article views including HTML views, PDF and ePub downloads, according to the available data) and Abstracts Views on Vision4Press platform.
Data correspond to usage on the plateform after 2015. The current usage metrics is available 48-96 hours after online publication and is updated daily on week days.
Initial download of the metrics may take a while.