Fig. 5.
Download original image
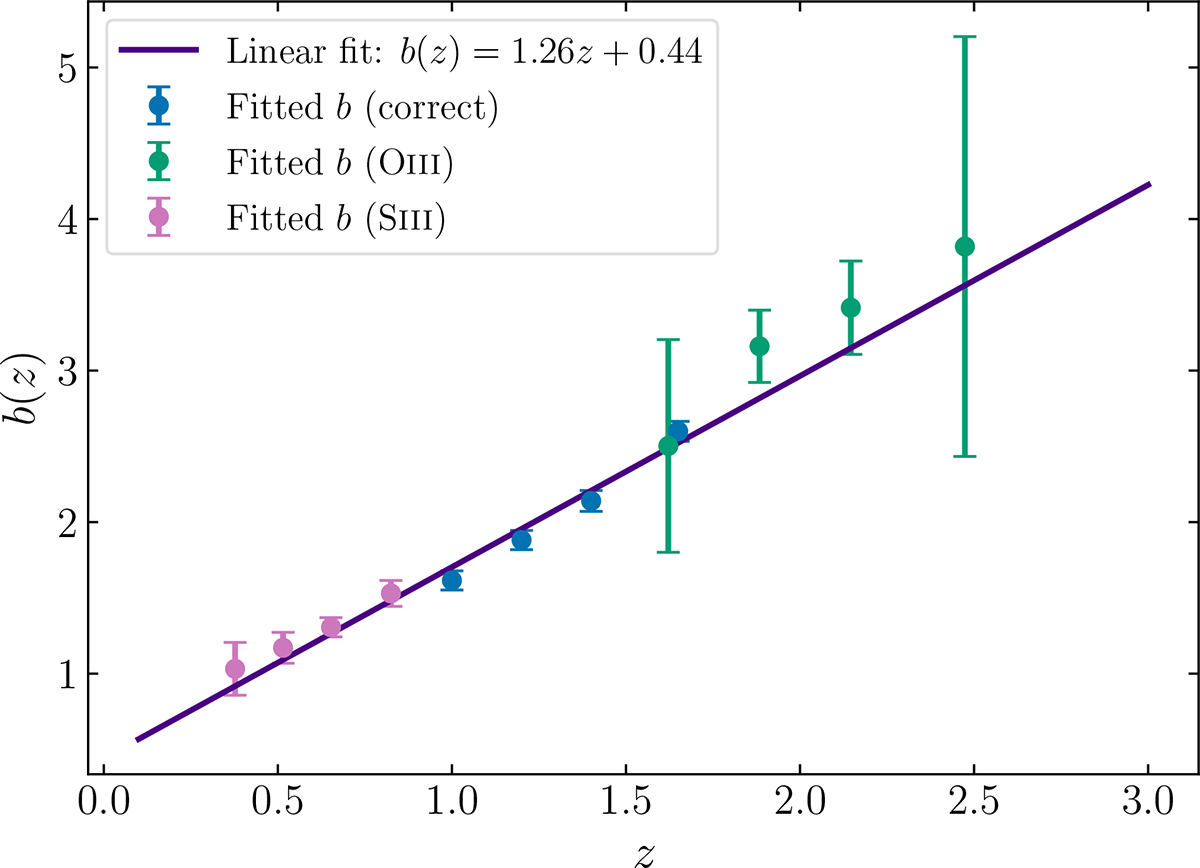
Redshift dependence of the bias in the EuclidLargeMocks, obtained by fitting the 2PCF of each population in the Euclid spectroscopic bins. Each colour refers to a different population and reveals the true redshifts of the line interlopers compared to correct galaxies. On top of the bias values, we plot the linear relation we derived to interpolate the bias’ redshift dependence.
Current usage metrics show cumulative count of Article Views (full-text article views including HTML views, PDF and ePub downloads, according to the available data) and Abstracts Views on Vision4Press platform.
Data correspond to usage on the plateform after 2015. The current usage metrics is available 48-96 hours after online publication and is updated daily on week days.
Initial download of the metrics may take a while.