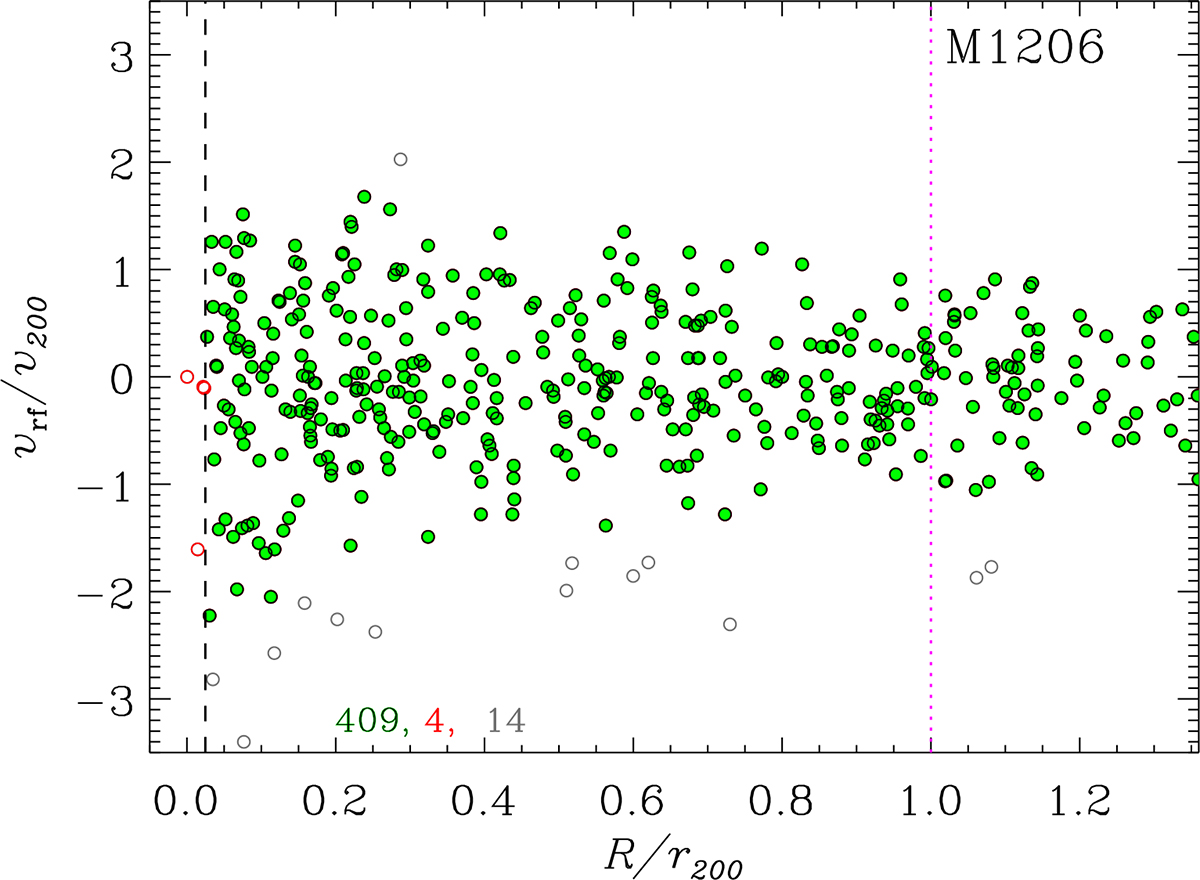
Fig. 1.
Download original image
Projected phase-space diagram of the 427 galaxies selected as members of the M1206 cluster (other clusters are shown in Fig. A.1) by the CLUMPS method in the region R ≤ 1.36 r200. The three numbers at the bottom left indicate, from left to right, the number of galaxies selected for the dynamical analysis (black-circled green dots); the number of CLUMPS members that are excluded from the dynamical analysis because they are at R ≤ 0.05 Mpc, which is the region dynamically dominated by the BCG (red circles), and the number of CLUMPS members that are not used in the dynamical analysis because they are flagged as interlopers by the escape-velocity criterion (gray circles). The vertical lines indicate R = 0.05 Mpc and R = r200. The values of r200 and v200 come from U18.
Current usage metrics show cumulative count of Article Views (full-text article views including HTML views, PDF and ePub downloads, according to the available data) and Abstracts Views on Vision4Press platform.
Data correspond to usage on the plateform after 2015. The current usage metrics is available 48-96 hours after online publication and is updated daily on week days.
Initial download of the metrics may take a while.