Open Access
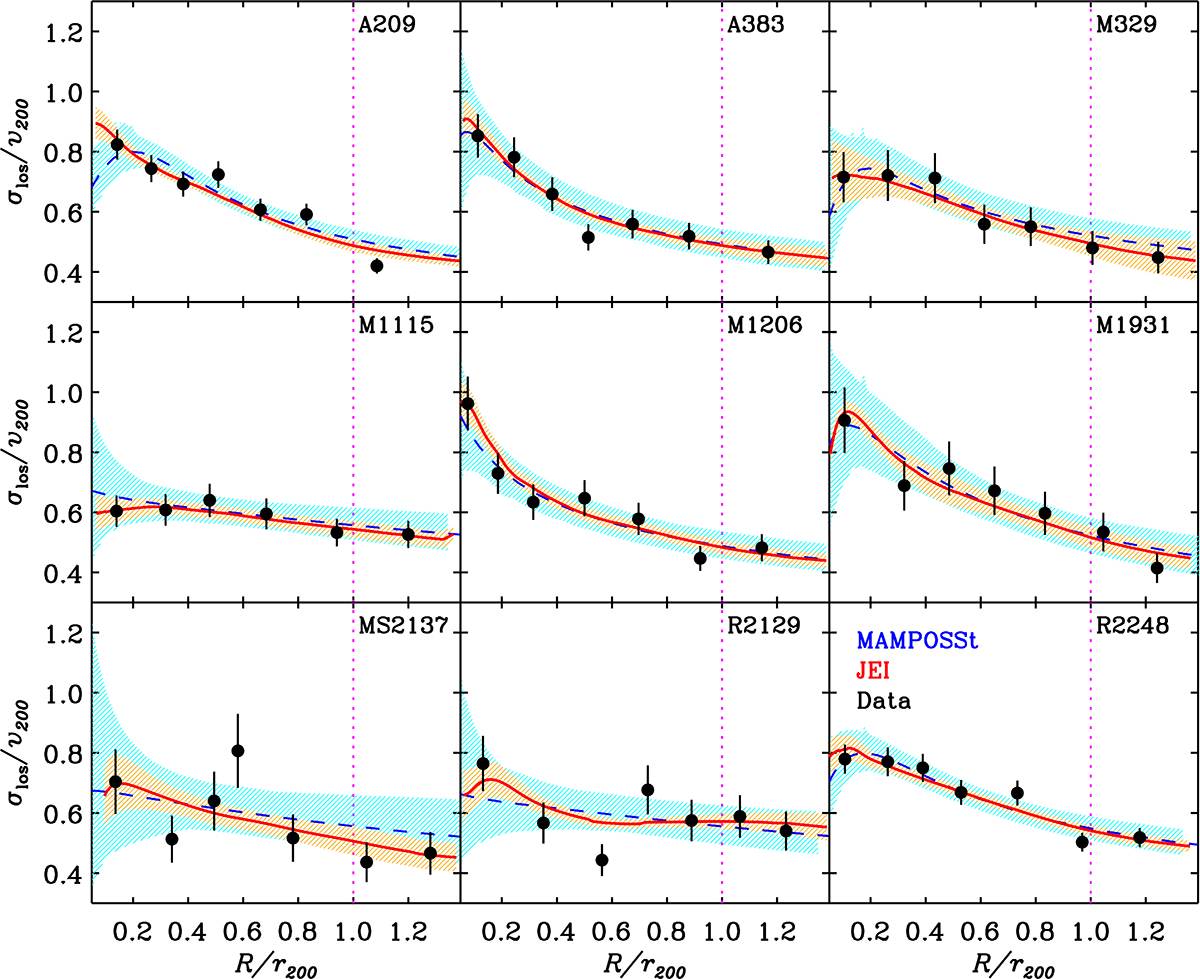
Fig. A.3.
Download original image
VDPs of the nine clusters. The meaning of the symbols is the same as in Fig. 2. The MAMPOSSt solution for all clusters is that obtained for the gOM β(r) model, except for M1931 for which the gT model is used, since it gives a better fit than the gOM model.
Current usage metrics show cumulative count of Article Views (full-text article views including HTML views, PDF and ePub downloads, according to the available data) and Abstracts Views on Vision4Press platform.
Data correspond to usage on the plateform after 2015. The current usage metrics is available 48-96 hours after online publication and is updated daily on week days.
Initial download of the metrics may take a while.