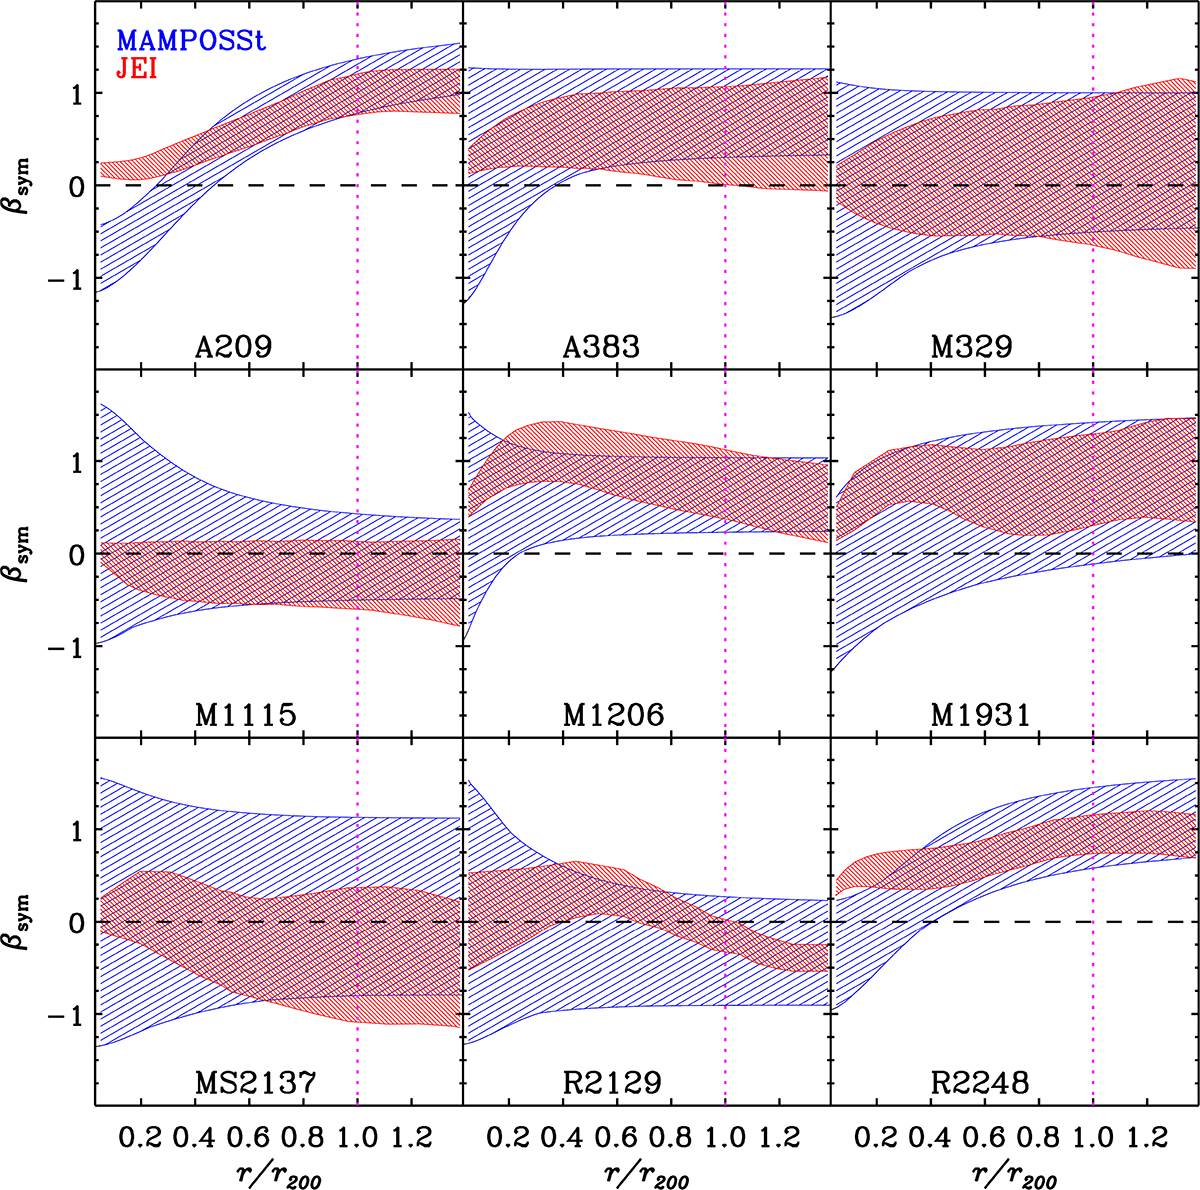
Fig. A.4.
Download original image
68% confidence regions for the MAMPOSStβsym(r) (blue) and for the JEIβsym(r) (red), for the nine clusters of our sample. The MAMPOSSt solution for all clusters is that obtained for the gOM β(r) model, except for M1931 for which the gT model is used, since it gives a better fit than the gOM model. The dashed horizontal line indicates isotropic orbits. Orbits are radial (respectively tangential) above (respectively below) this line.
Current usage metrics show cumulative count of Article Views (full-text article views including HTML views, PDF and ePub downloads, according to the available data) and Abstracts Views on Vision4Press platform.
Data correspond to usage on the plateform after 2015. The current usage metrics is available 48-96 hours after online publication and is updated daily on week days.
Initial download of the metrics may take a while.