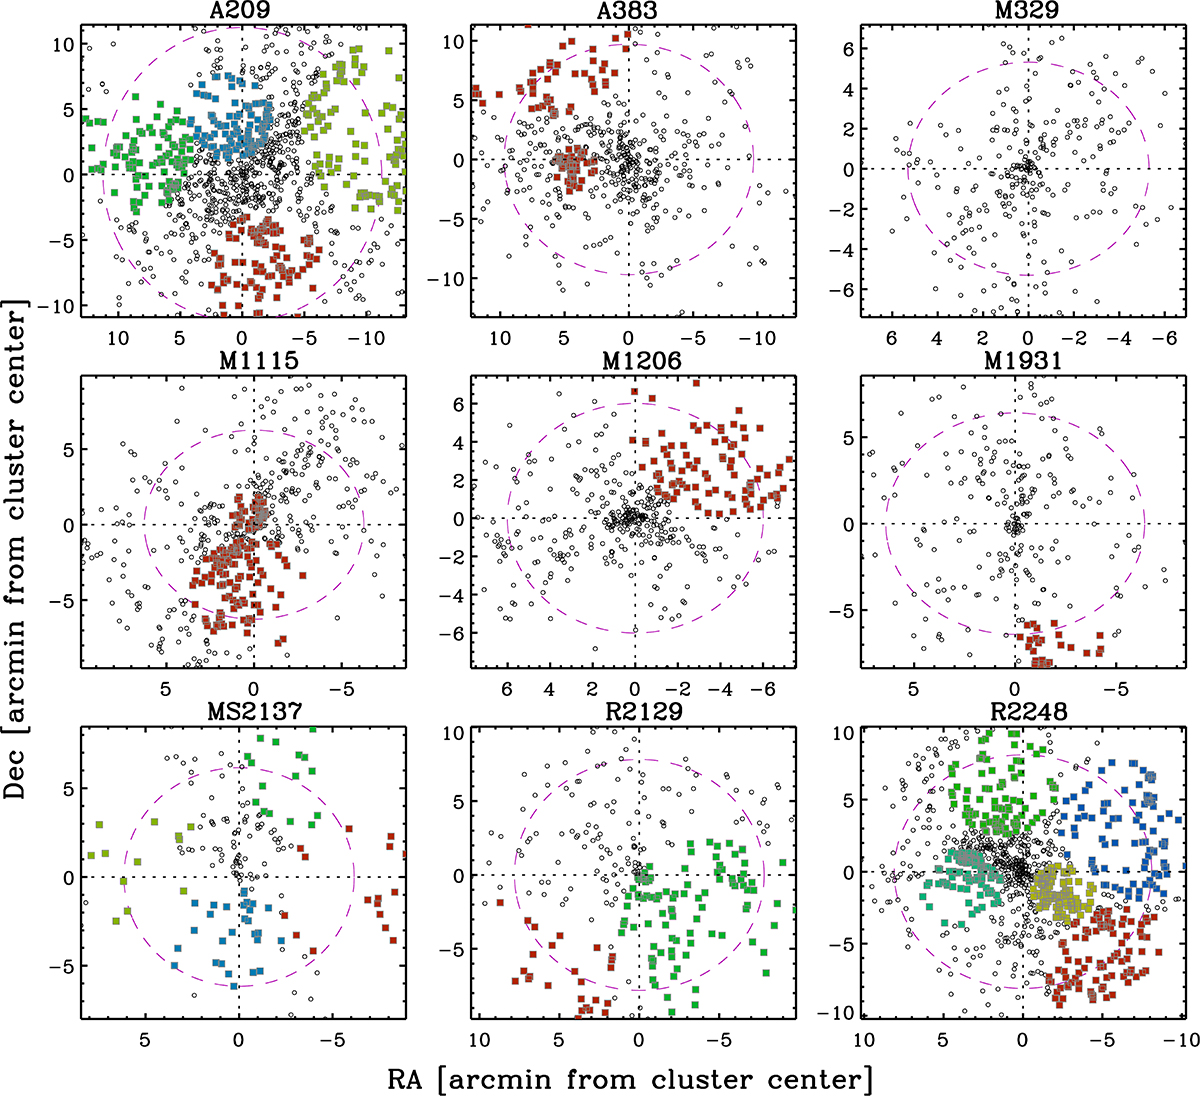
Fig. A.5.
Download original image
Subclusters identified with the DS+ method in the nine clusters. Galaxies assigned to subclusters are shown as gray squares filled with different colors to distinguish the different subclusters. Cluster members outside subclusters are shown as black diamonds. No subcluster was identified in M329. The magenta dashed circle represents the r200 region, and the dotted lines identify the cluster center.
Current usage metrics show cumulative count of Article Views (full-text article views including HTML views, PDF and ePub downloads, according to the available data) and Abstracts Views on Vision4Press platform.
Data correspond to usage on the plateform after 2015. The current usage metrics is available 48-96 hours after online publication and is updated daily on week days.
Initial download of the metrics may take a while.