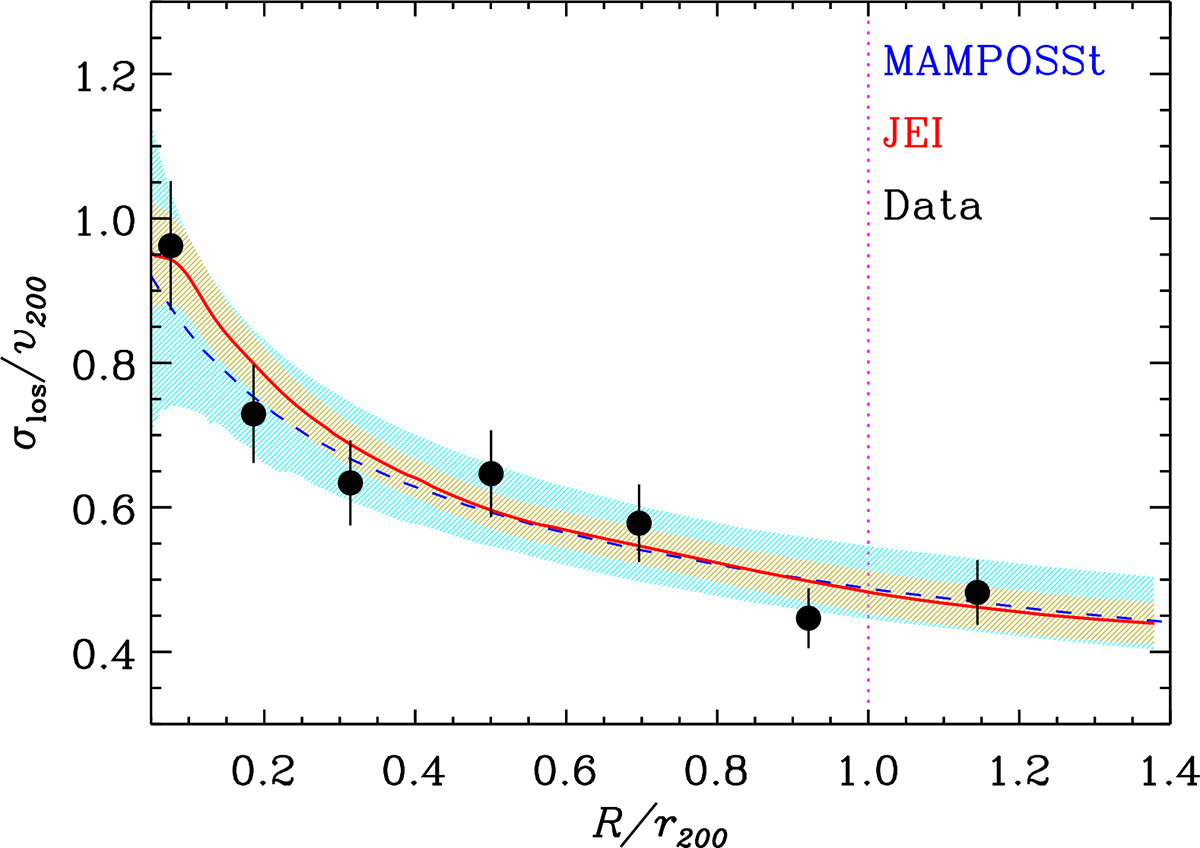
Fig. 2.
Download original image
Dots with 1σ error bars: los VDP of M1206. Dashed blue line and cyan shading: Best-fit MAMPOSSt solution within 68% confidence levels, estimated on a random selection of 3000 MCMC steps. Red solid line and orange shading: JEI-predicted VDP and 68% confidence levels. The values of r200 (indicated by the vertical magenta line) and v200 are the best fits of the MAMPOSSt analysis (other clusters are shown in Fig. A.3.)
Current usage metrics show cumulative count of Article Views (full-text article views including HTML views, PDF and ePub downloads, according to the available data) and Abstracts Views on Vision4Press platform.
Data correspond to usage on the plateform after 2015. The current usage metrics is available 48-96 hours after online publication and is updated daily on week days.
Initial download of the metrics may take a while.