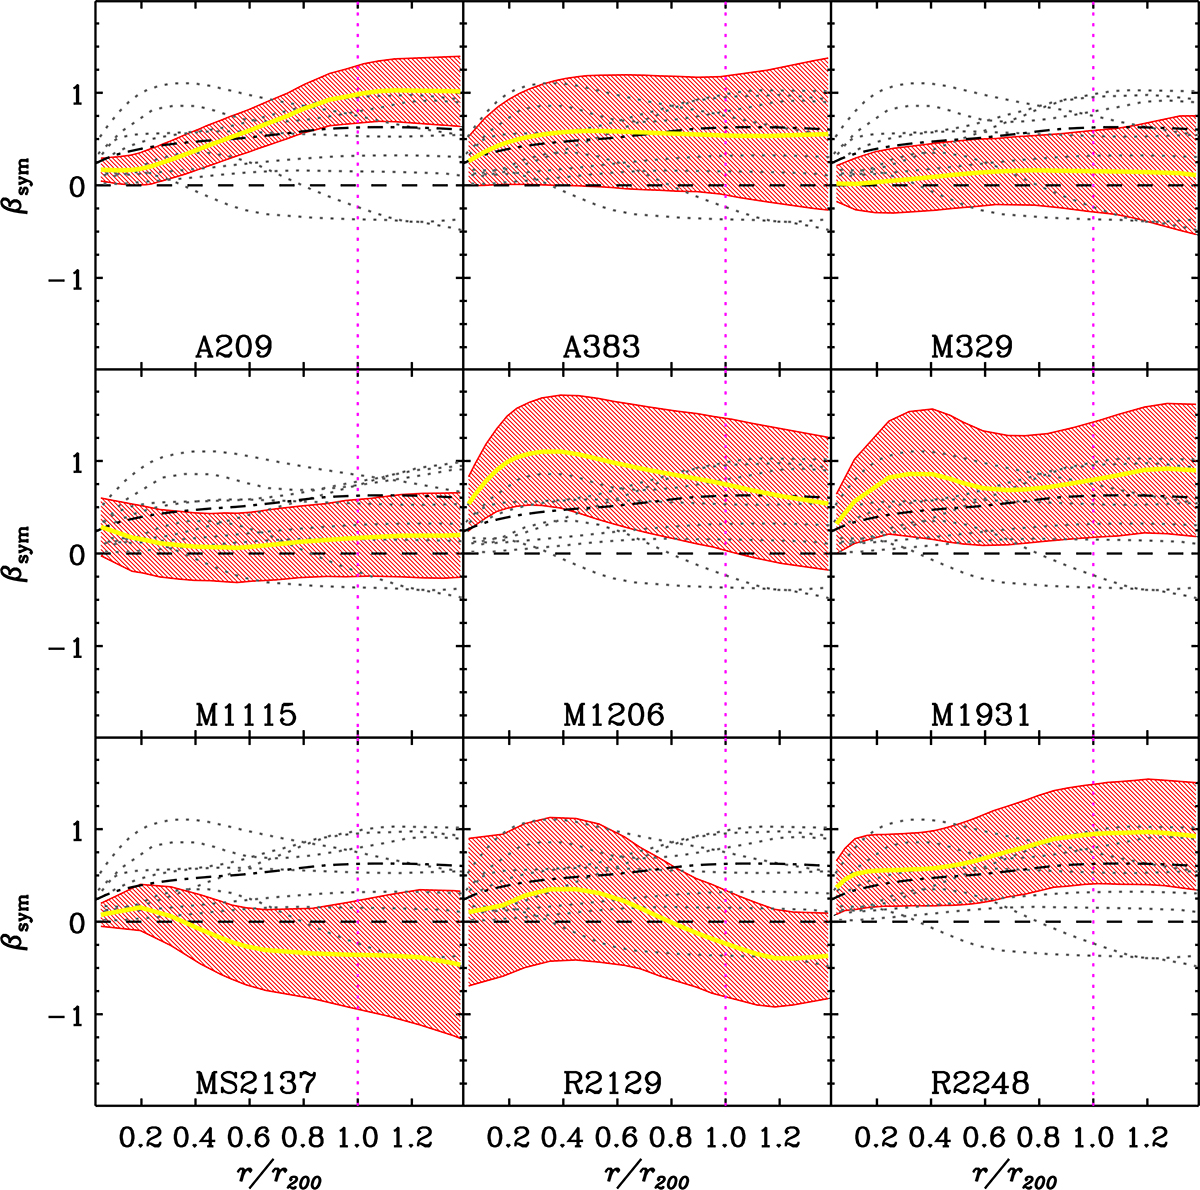
Fig. 3.
Download original image
Each panel shows the 1σ confidence levels of a cluster JEIβsym(r), as obtained from the procedure described in Sect. 3.3 (red shadings), and its central value (yellow line), the weighted mean of the nine profiles, ⟨βsym(r)⟩, as defined in Eq. (6) (black dash-dotted line), and the βsym(r) of the other eight clusters (black dotted lines). The horizontal dashed black line indicates isotropic orbits. Orbits are radial above this line and tangential below it.
Current usage metrics show cumulative count of Article Views (full-text article views including HTML views, PDF and ePub downloads, according to the available data) and Abstracts Views on Vision4Press platform.
Data correspond to usage on the plateform after 2015. The current usage metrics is available 48-96 hours after online publication and is updated daily on week days.
Initial download of the metrics may take a while.