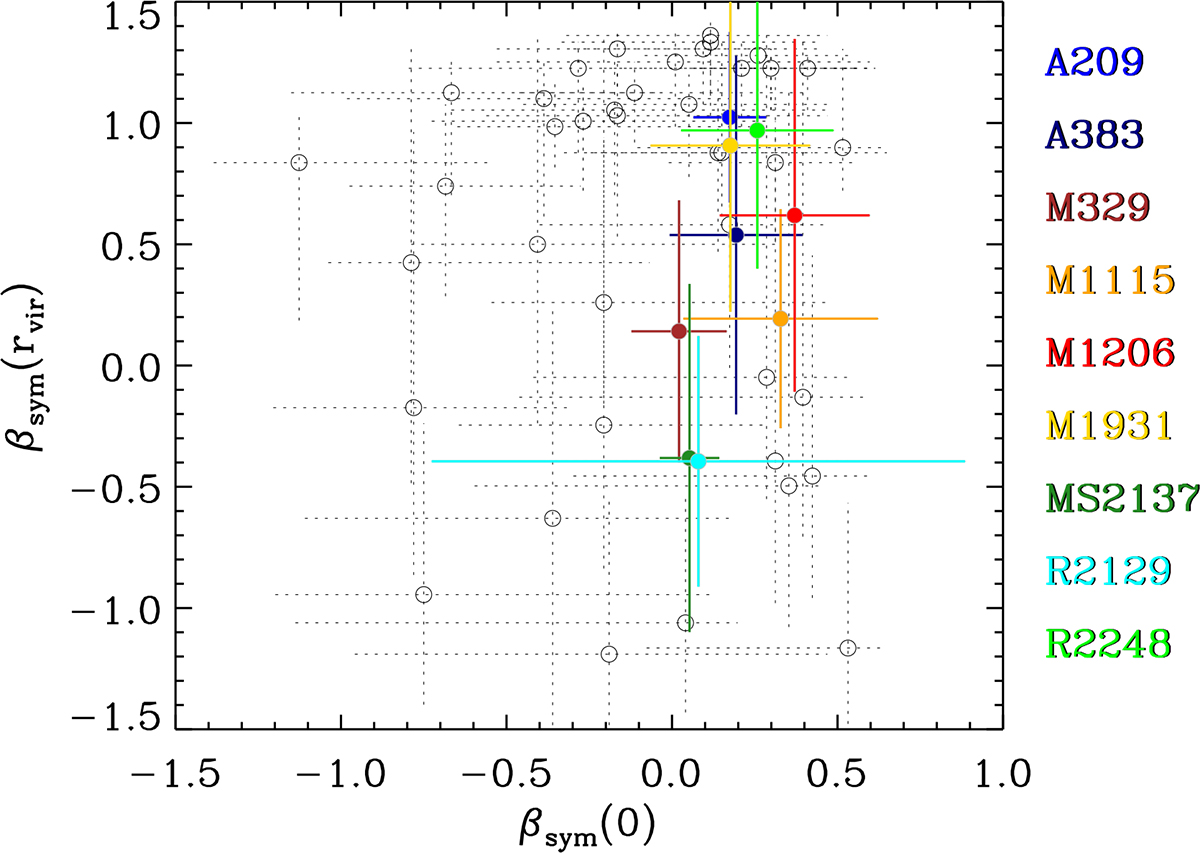
Fig. 6.
Download original image
Velocity anisotropy βsym at r = rvir, vs. velocity anisotropy at r = 0, for our nine clusters (colored dots) and for the lower-z clusters of Wojtak & Łokas (2010, black circles). The 1σ error bars are shown. The virial radius is rvir = r100 for the nearby clusters of Wojtak & Łokas (2010), and it is approximated by r126 for our clusters. The colors identify our nine clusters, in order of increasing redshift with increasing color wavelength (from blue to brown).
Current usage metrics show cumulative count of Article Views (full-text article views including HTML views, PDF and ePub downloads, according to the available data) and Abstracts Views on Vision4Press platform.
Data correspond to usage on the plateform after 2015. The current usage metrics is available 48-96 hours after online publication and is updated daily on week days.
Initial download of the metrics may take a while.