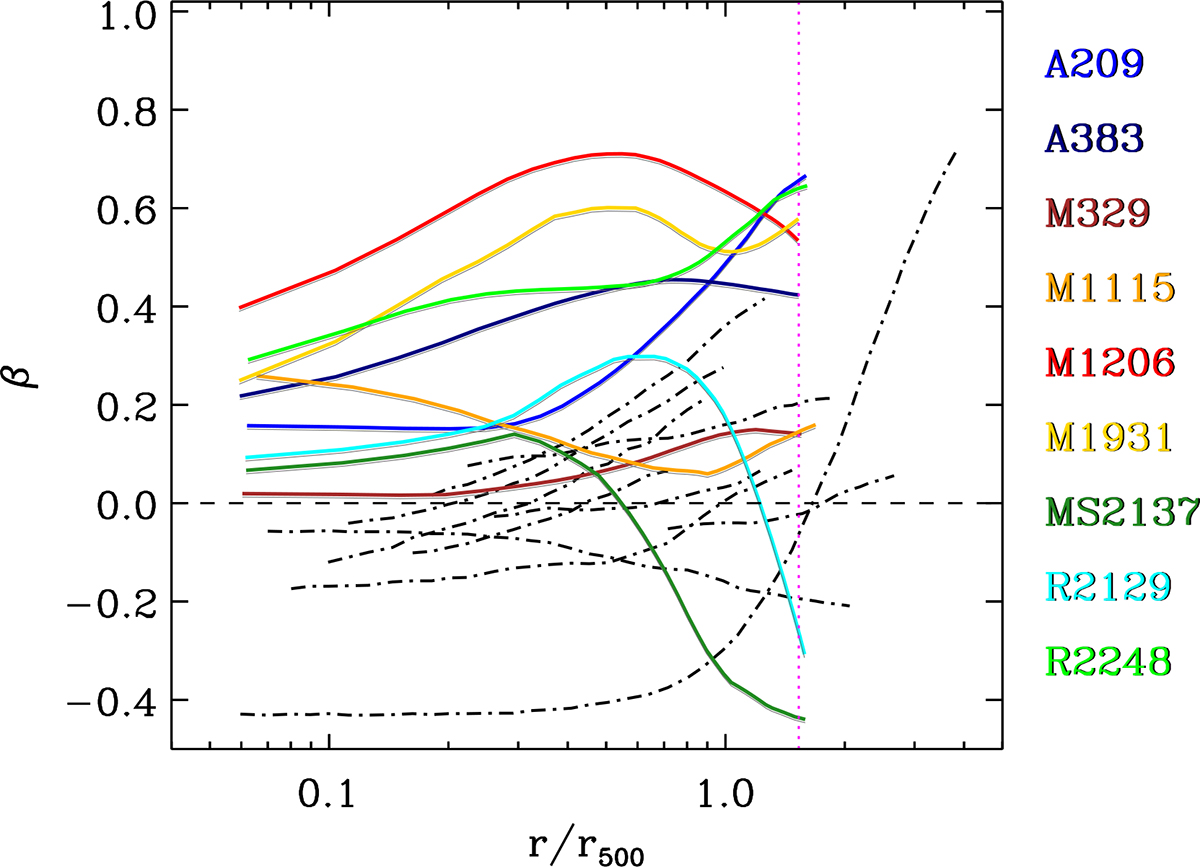
Fig. 7.
Download original image
β(r) of our nine clusters (colored solid lines) and of the ten nearby clusters of Li et al. (2023, black dot-dashed lines) displayed in the same format as that of Fig. 4 in Li et al. (2023). The colors identify our nine clusters, in order of increasing redshift with increasing color wavelength (from blue to brown). The vertical magenta dotted line indicates 1.5 r500, which is on average equivalent to r200 for our nine clusters.
Current usage metrics show cumulative count of Article Views (full-text article views including HTML views, PDF and ePub downloads, according to the available data) and Abstracts Views on Vision4Press platform.
Data correspond to usage on the plateform after 2015. The current usage metrics is available 48-96 hours after online publication and is updated daily on week days.
Initial download of the metrics may take a while.