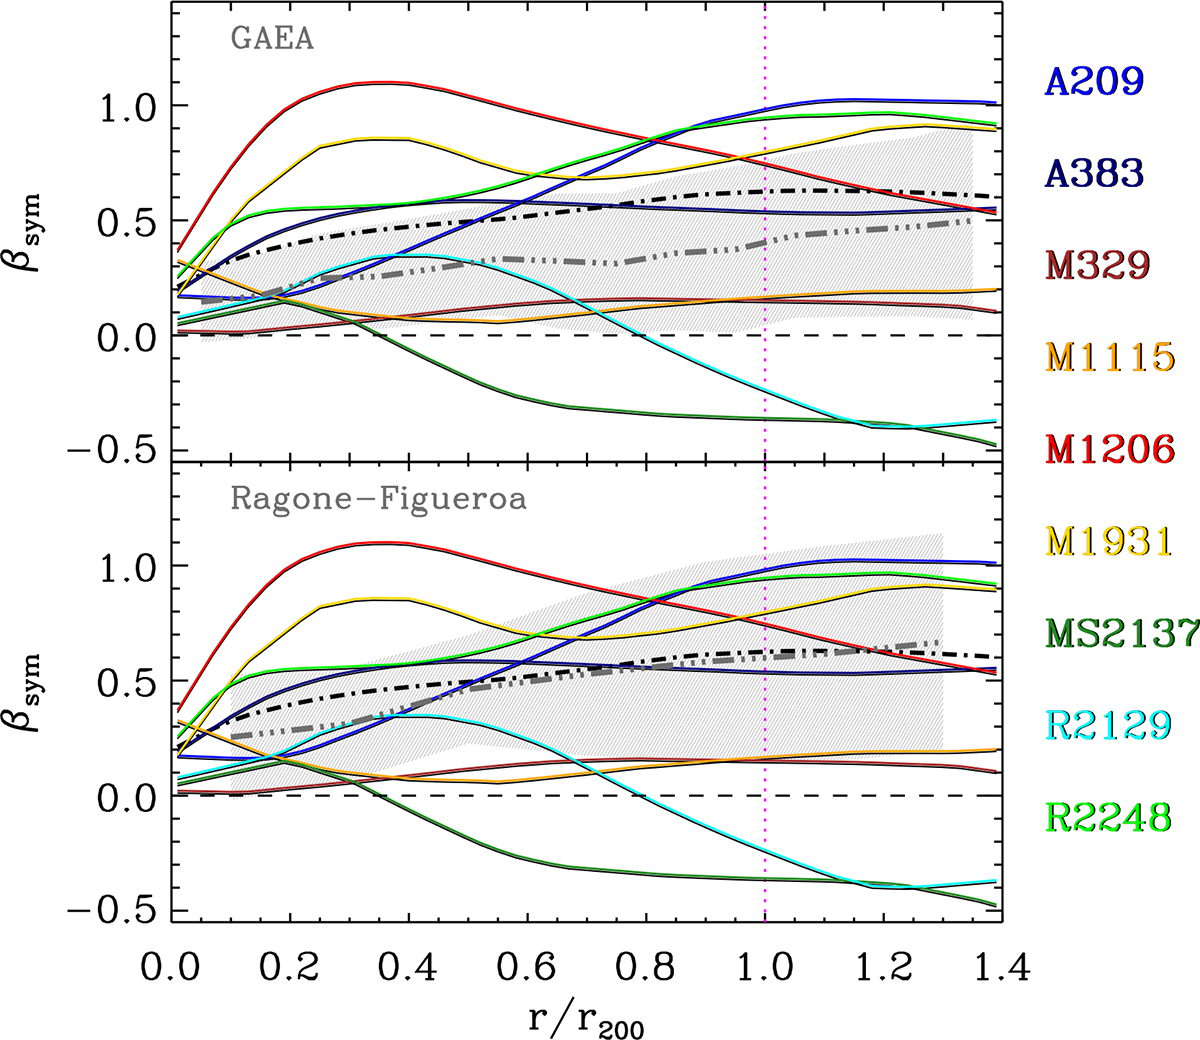
Fig. 8.
Download original image
Upper panel: Nine clusters βsym(r) (color-coded in order of increasing redshift with increasing color wavelength, from blue to brown) and their weighted mean velocity anisotropy profile ⟨β(r)⟩ (dash-dotted black line) compared to the mean profile of 112 halos in the GAEA simulation (triple-dot-dashed gray line) and its rms (gray shading). Lower panel: Same as the upper panel, but the comparison is made with the mean profile of 25 halos in the RF simulation.
Current usage metrics show cumulative count of Article Views (full-text article views including HTML views, PDF and ePub downloads, according to the available data) and Abstracts Views on Vision4Press platform.
Data correspond to usage on the plateform after 2015. The current usage metrics is available 48-96 hours after online publication and is updated daily on week days.
Initial download of the metrics may take a while.