Fig. 10
Download original image
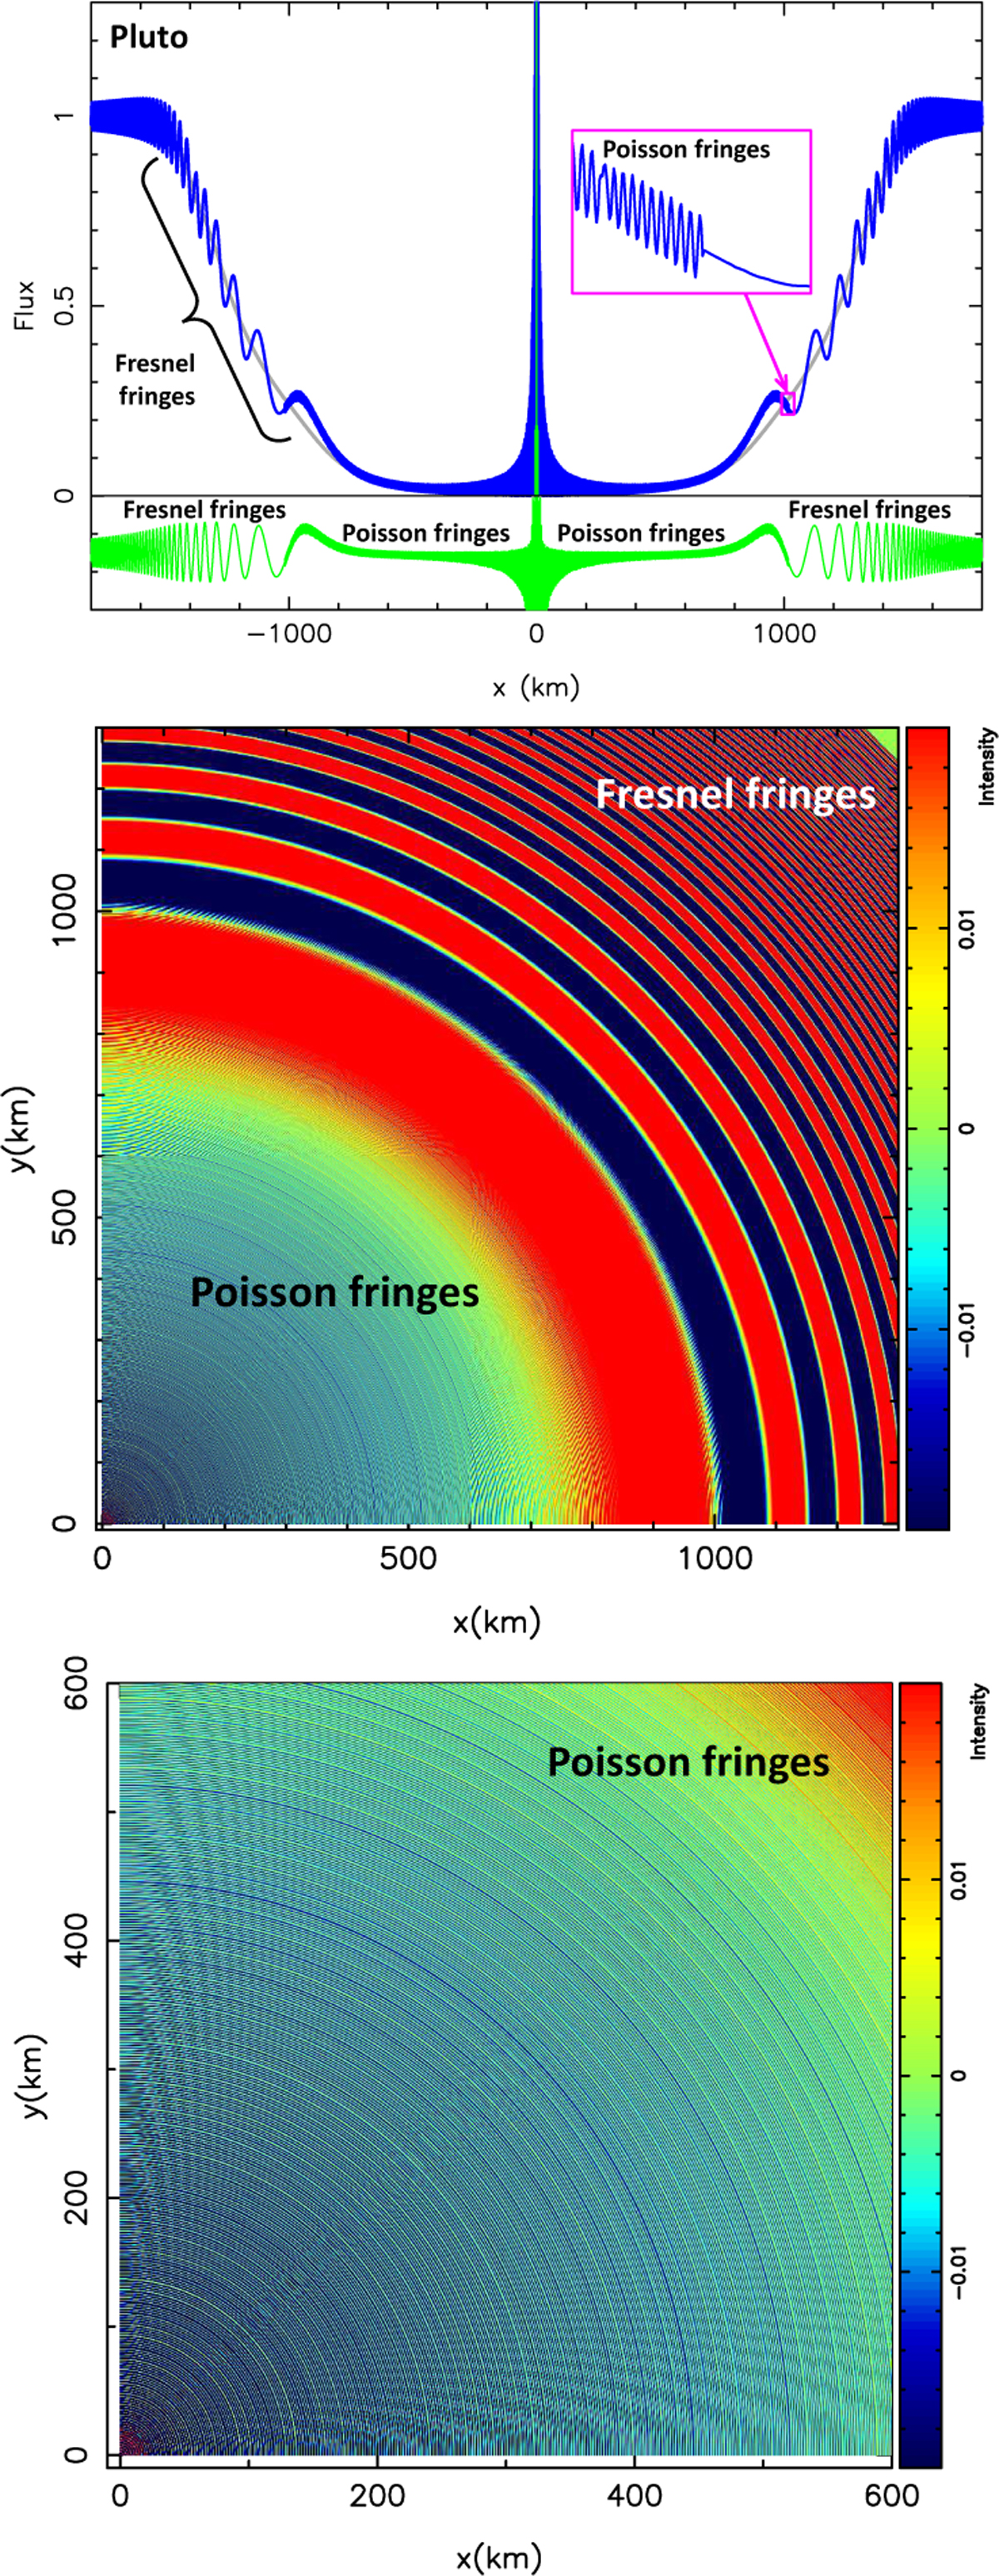
Upper panel : same as Fig. 7 but with a larger wavelength λ = 1 mm, hence a Fresnel scale λF = 50 km. The Fresnel fringes seen at the outer part of the shadow (|x| ≳ 1020 km) are separated by several tens of kilometers, while the Poisson fringes appearing at |x| ≲ 1020 km, have separations of about 2 km and are not resolved in the panel. The 50-km-wide box (magenta) shows the resolved Poisson fringes vanishing as the secondary image disappears behind the limb. The green curve is the difference between the blue curve (wave optics) and the gray curve (geometrical optics), displaced vertically by −0.15 for better viewing. Middle panel: 2D map based on the green curve of the upper panel, enhancing the difference between the Fresnel and Poisson fringes. Lower panel : enlargement of the middle panel, which reveals the fine striations caused by the Poisson fringes.
Current usage metrics show cumulative count of Article Views (full-text article views including HTML views, PDF and ePub downloads, according to the available data) and Abstracts Views on Vision4Press platform.
Data correspond to usage on the plateform after 2015. The current usage metrics is available 48-96 hours after online publication and is updated daily on week days.
Initial download of the metrics may take a while.