Fig. 12
Download original image
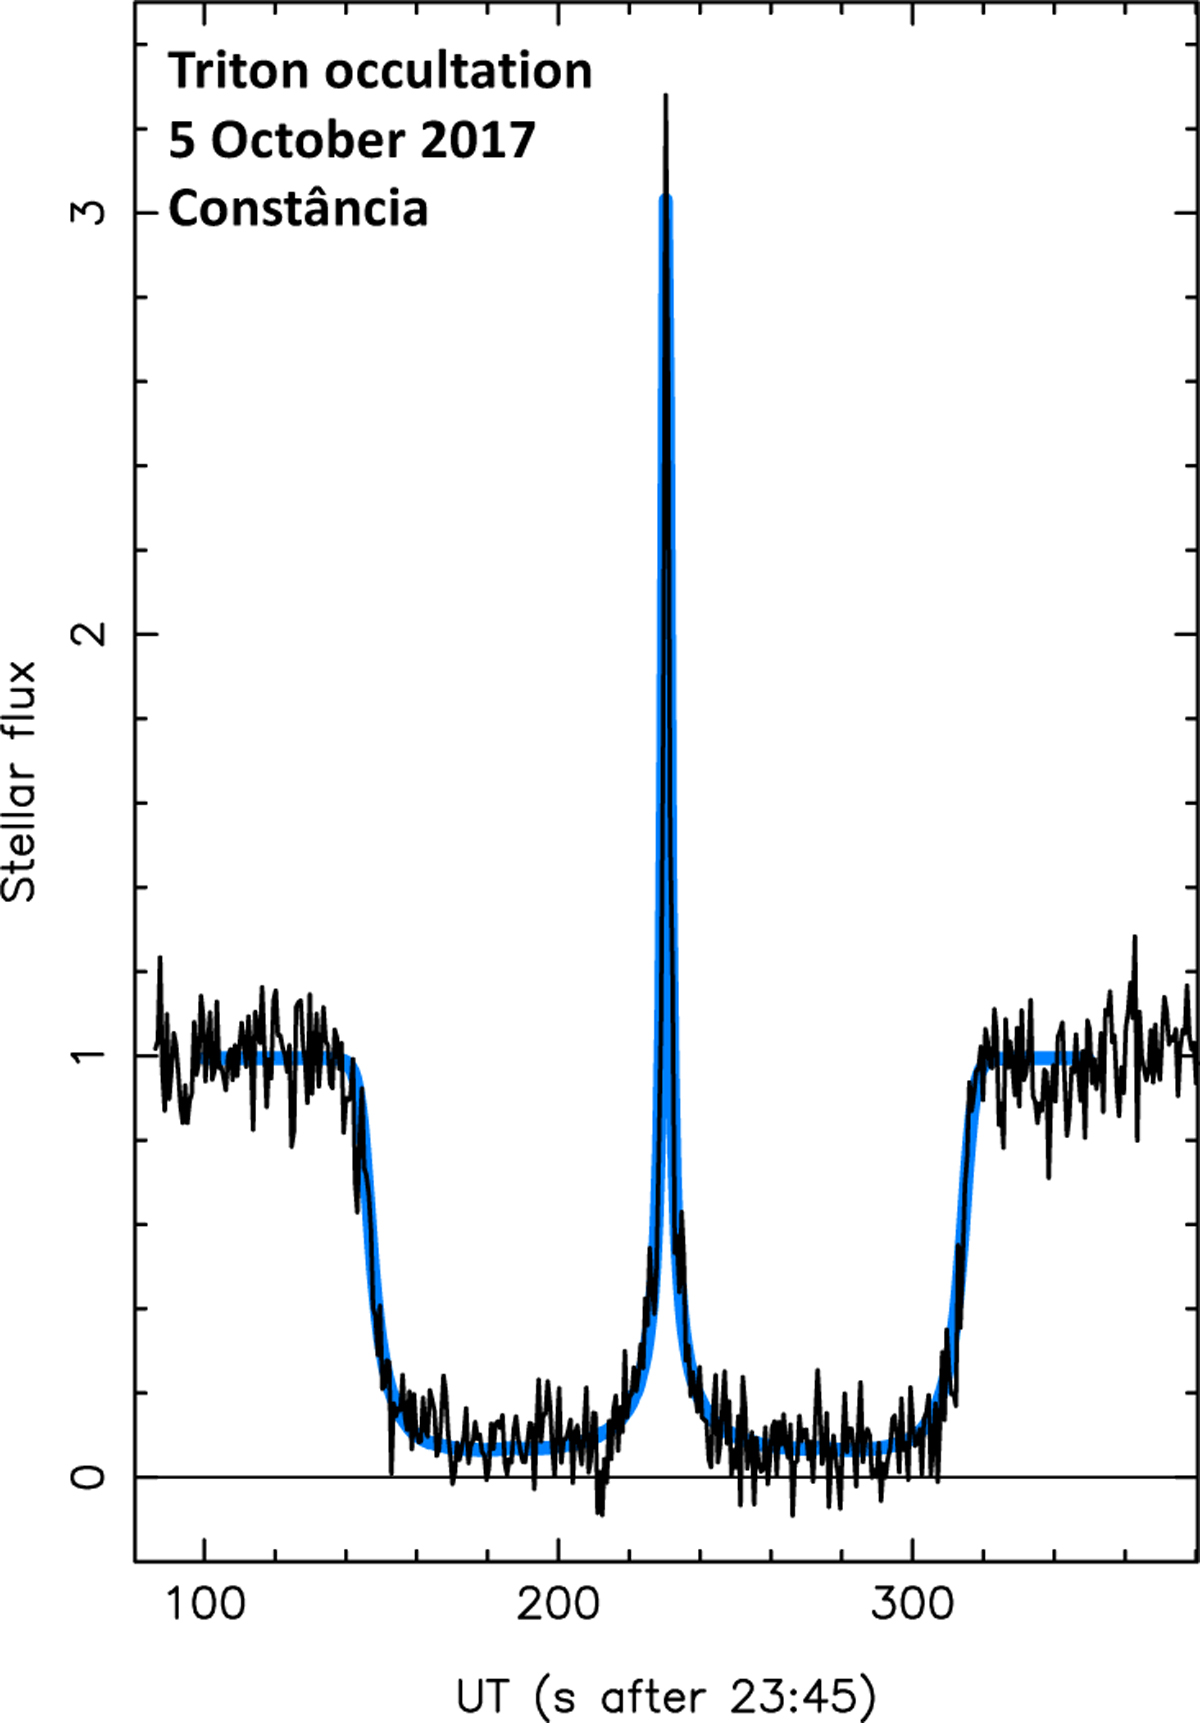
Occultation light curve observed from the Constância station during the stellar occultation by Triton on 5 October 2017. The blue curve is a fit to the data using a ray tracing code that assumes a pointlike star, a spherical atmosphere, and geometrical optics. The observed peak value of the flash is about 3.3 times the flux of the unocculted star.
Current usage metrics show cumulative count of Article Views (full-text article views including HTML views, PDF and ePub downloads, according to the available data) and Abstracts Views on Vision4Press platform.
Data correspond to usage on the plateform after 2015. The current usage metrics is available 48-96 hours after online publication and is updated daily on week days.
Initial download of the metrics may take a while.