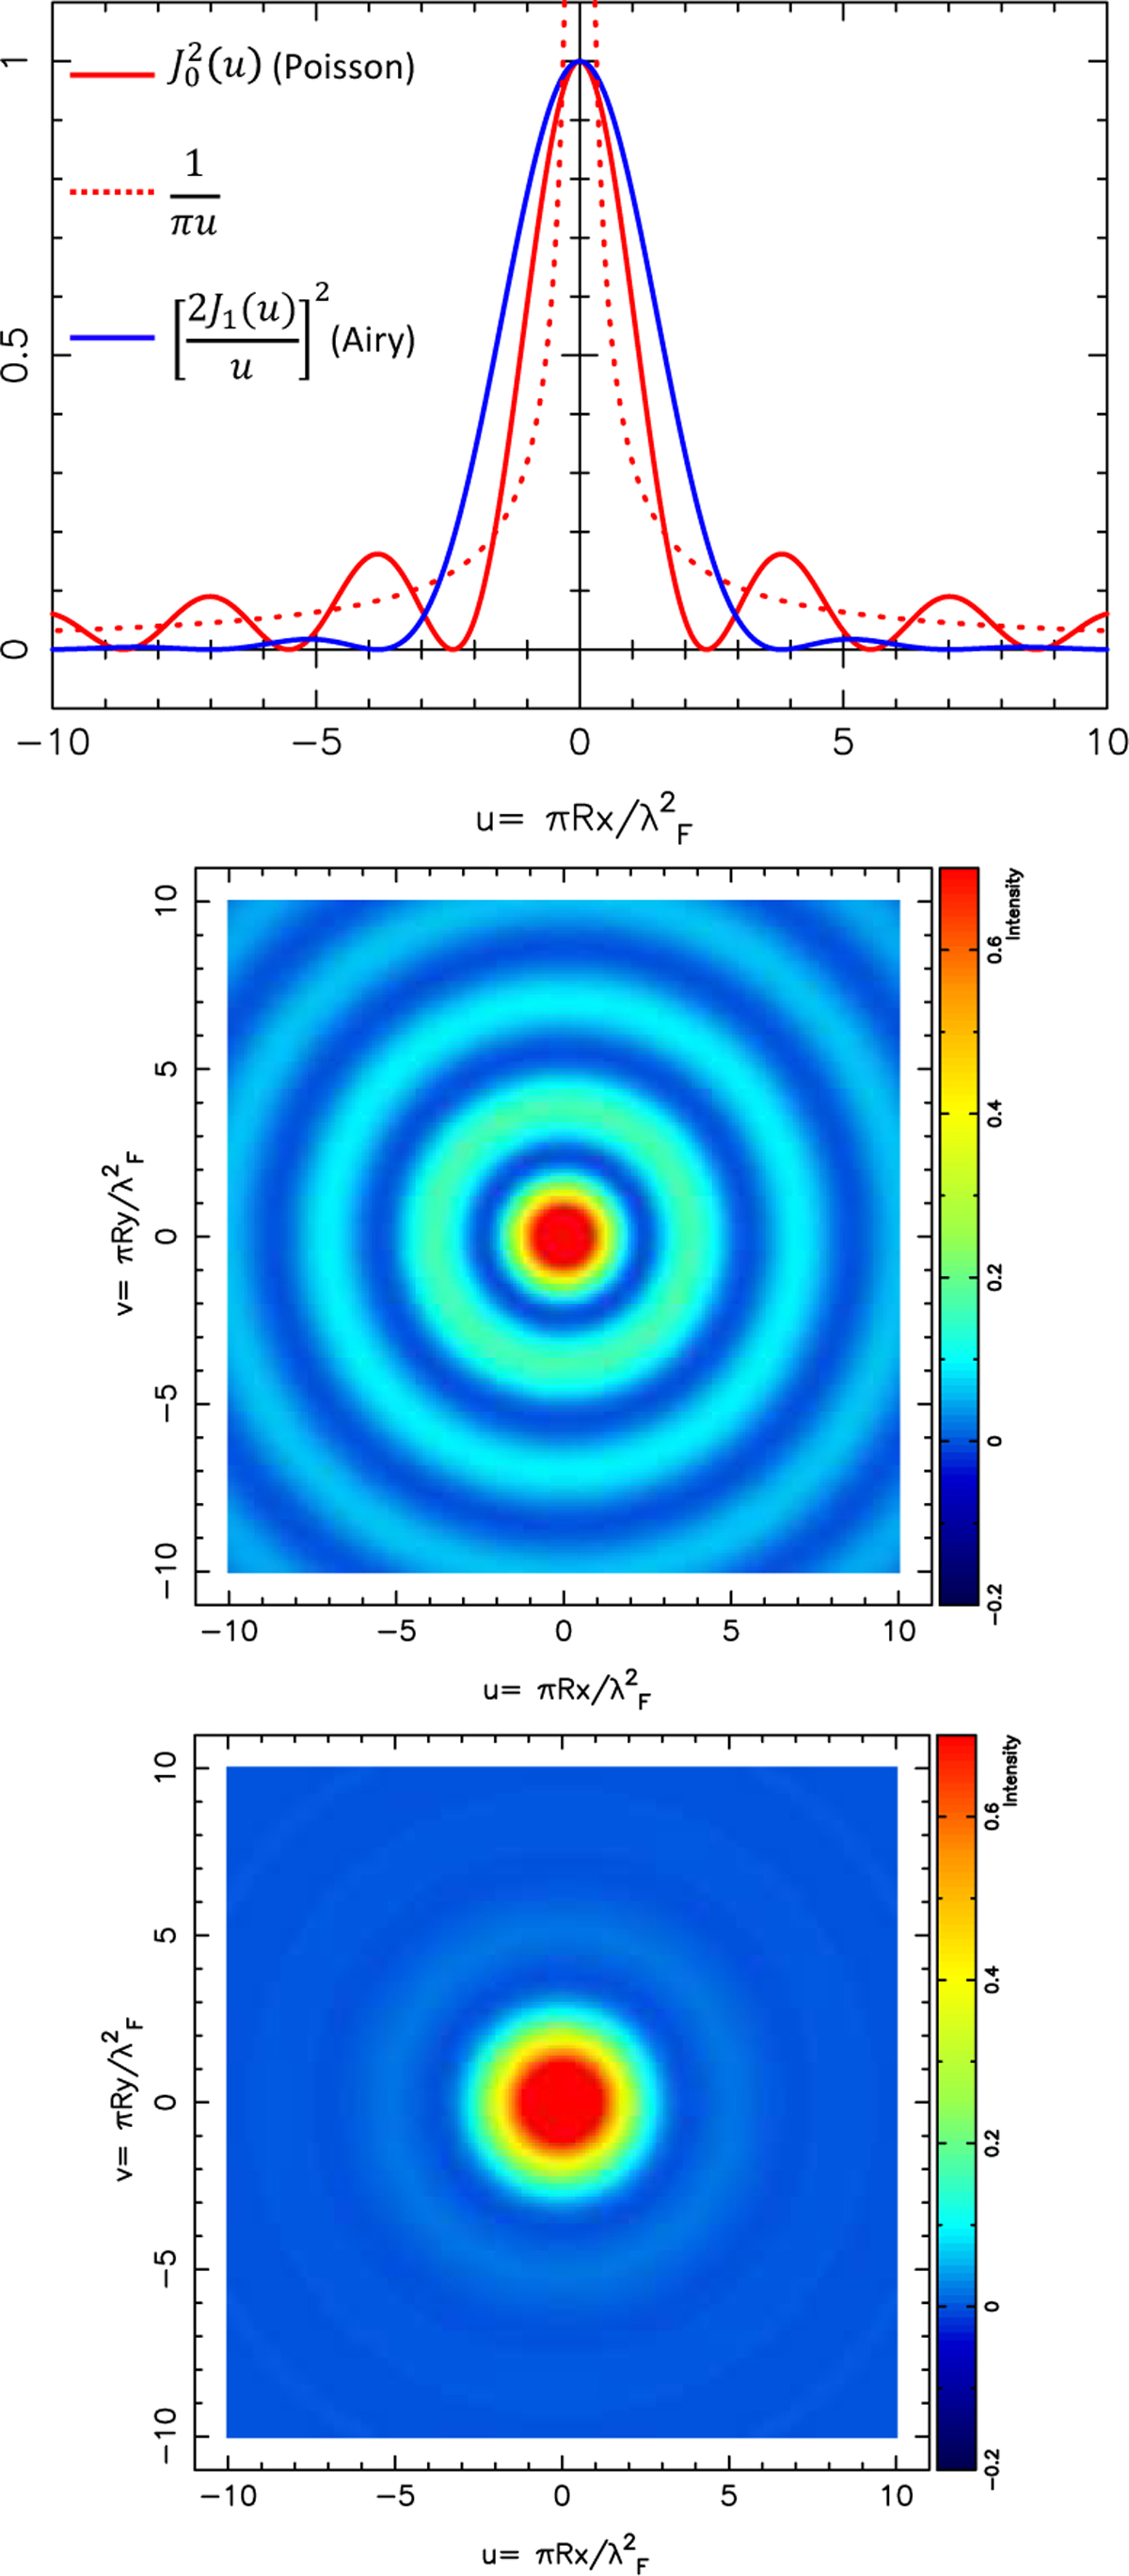
Fig. C.1
Download original image
Upper panel : Radial profile of the Poisson spot created by an opaque circular disk of radius R is plotted in red, while the Airy disk profile created by a lens of same radius is plotted in blue. Both profiles are normalized to unity at r = 0. The Poisson spot is described by the function J02(u) (Eq. 27), while the Airy disk is described by the function [2J1(u)/u]2 (Eq. C.1). The normalized geometrical optics approximation given by Eq. 9 is plotted as a red dotted line which diverges to infinity at the origin. The Poisson spot is narrower than the corresponding Airy disk by about 60% (Eqs. 29 and C.2). The fringes around the Poisson spot damp out more slowly (∝ 1/u) that those of the Airy disk (∝ 1/u3); see Eq C.3. Middle panel : 2D-map of the Poisson spot, corresponding to the red profile in the upper panel. Lower panel : 2D-map of the Airy disk, corresponding to the blue profile in the upper panel.
Current usage metrics show cumulative count of Article Views (full-text article views including HTML views, PDF and ePub downloads, according to the available data) and Abstracts Views on Vision4Press platform.
Data correspond to usage on the plateform after 2015. The current usage metrics is available 48-96 hours after online publication and is updated daily on week days.
Initial download of the metrics may take a while.