Fig. D.1
Download original image
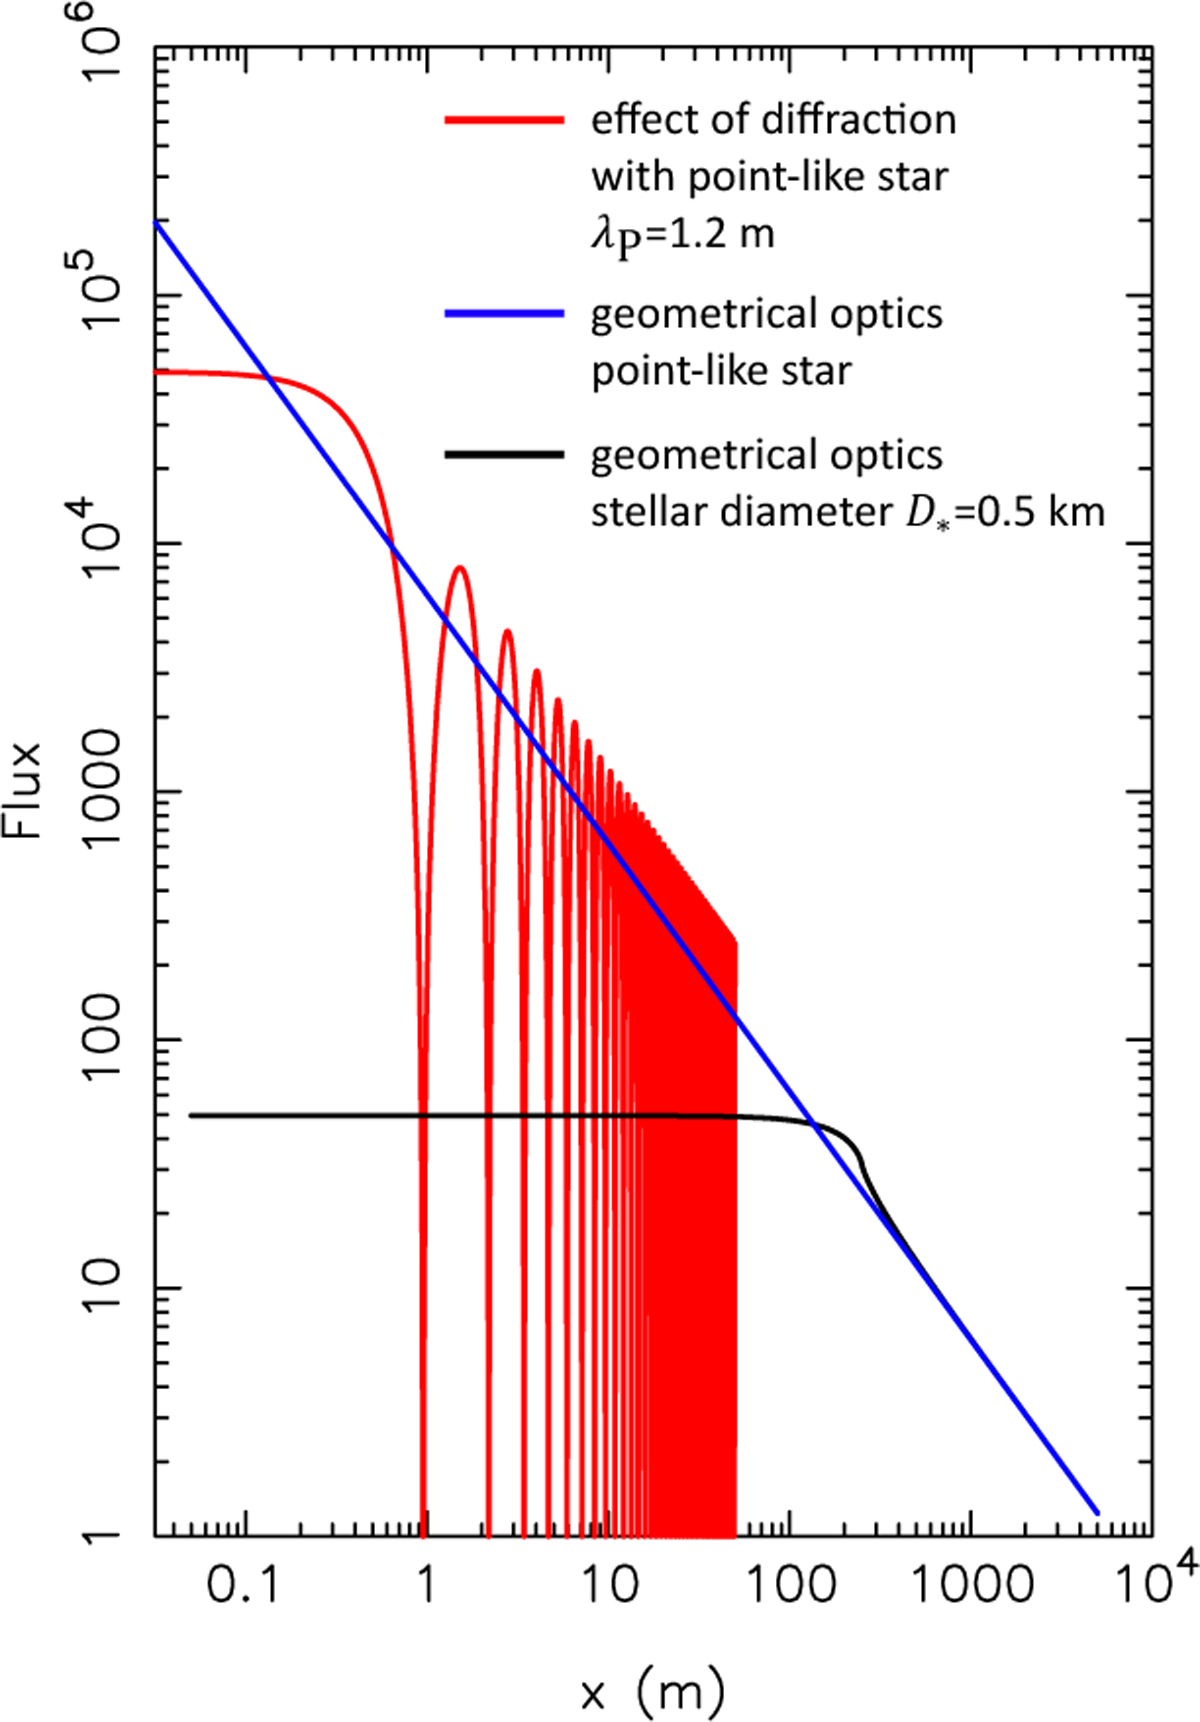
Log-log plot showing the flash profiles caused by a spherical and transparent Pluto’s atmosphere, as derived from the 6 June 2020 occultation (Sicardy et al. 2021) and using the parameters listed in Table 2. Red curve: the flash caused by a point-like star and monochromatic wave, giving a finite diffraction peak and interference fringes (because Pluto’s atmosphere is dense) with spacing λP ≈ 1.2 m (Table 2). The flash has then the same radial dependence as the Poisson curve shown in red curve in Fig. 3; Black curve: the flash caused by a star with a diameter D* = 0.5 km projected at Pluto’s distance (Eqs. 57 and 61); Blue curve: the flash obtained using the geometrical optics approximation (Eq. 6).
Current usage metrics show cumulative count of Article Views (full-text article views including HTML views, PDF and ePub downloads, according to the available data) and Abstracts Views on Vision4Press platform.
Data correspond to usage on the plateform after 2015. The current usage metrics is available 48-96 hours after online publication and is updated daily on week days.
Initial download of the metrics may take a while.