Fig. 5
Download original image
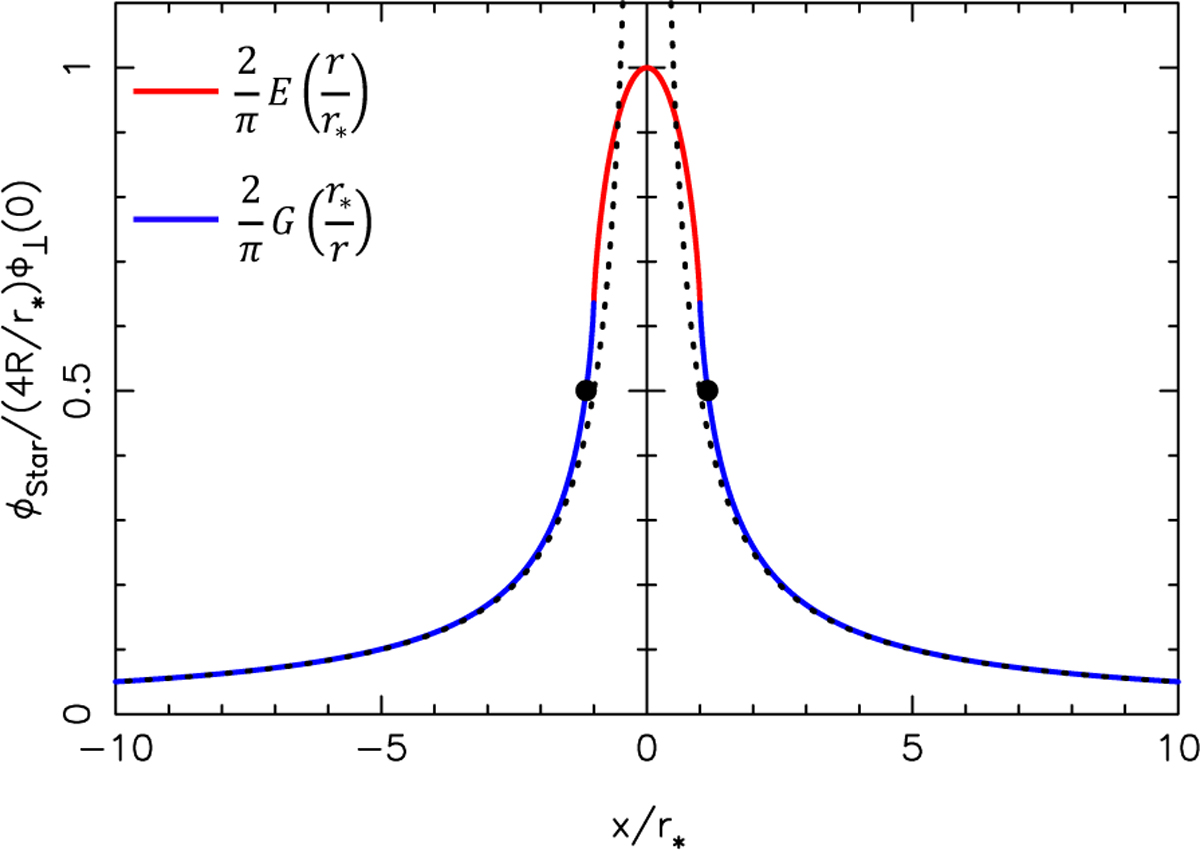
Central flash resulting from a finite stellar radius r* projected at the body distance, in the geometrical optics regime. The plot has been generated by used Eq. (57) (blue part) and Eq. (61) (red part). The functions E and G are given in Eq. (59) and Table F.1. The values along the horizontal axis have been normalized to the stellar radius r*, while the flux along the vertical axis has been normalized to its peak value 4(R/r*)φ⊥(0) (Eq. (62)). The two bullets show the values x/r* = ±1.14 where the flash reaches half of its maximum value. The dotted line shows the diverging flash profile produced by a point-like star in the geometrical optics approximation (Eq. (9)).
Current usage metrics show cumulative count of Article Views (full-text article views including HTML views, PDF and ePub downloads, according to the available data) and Abstracts Views on Vision4Press platform.
Data correspond to usage on the plateform after 2015. The current usage metrics is available 48-96 hours after online publication and is updated daily on week days.
Initial download of the metrics may take a while.