Fig. 6
Download original image
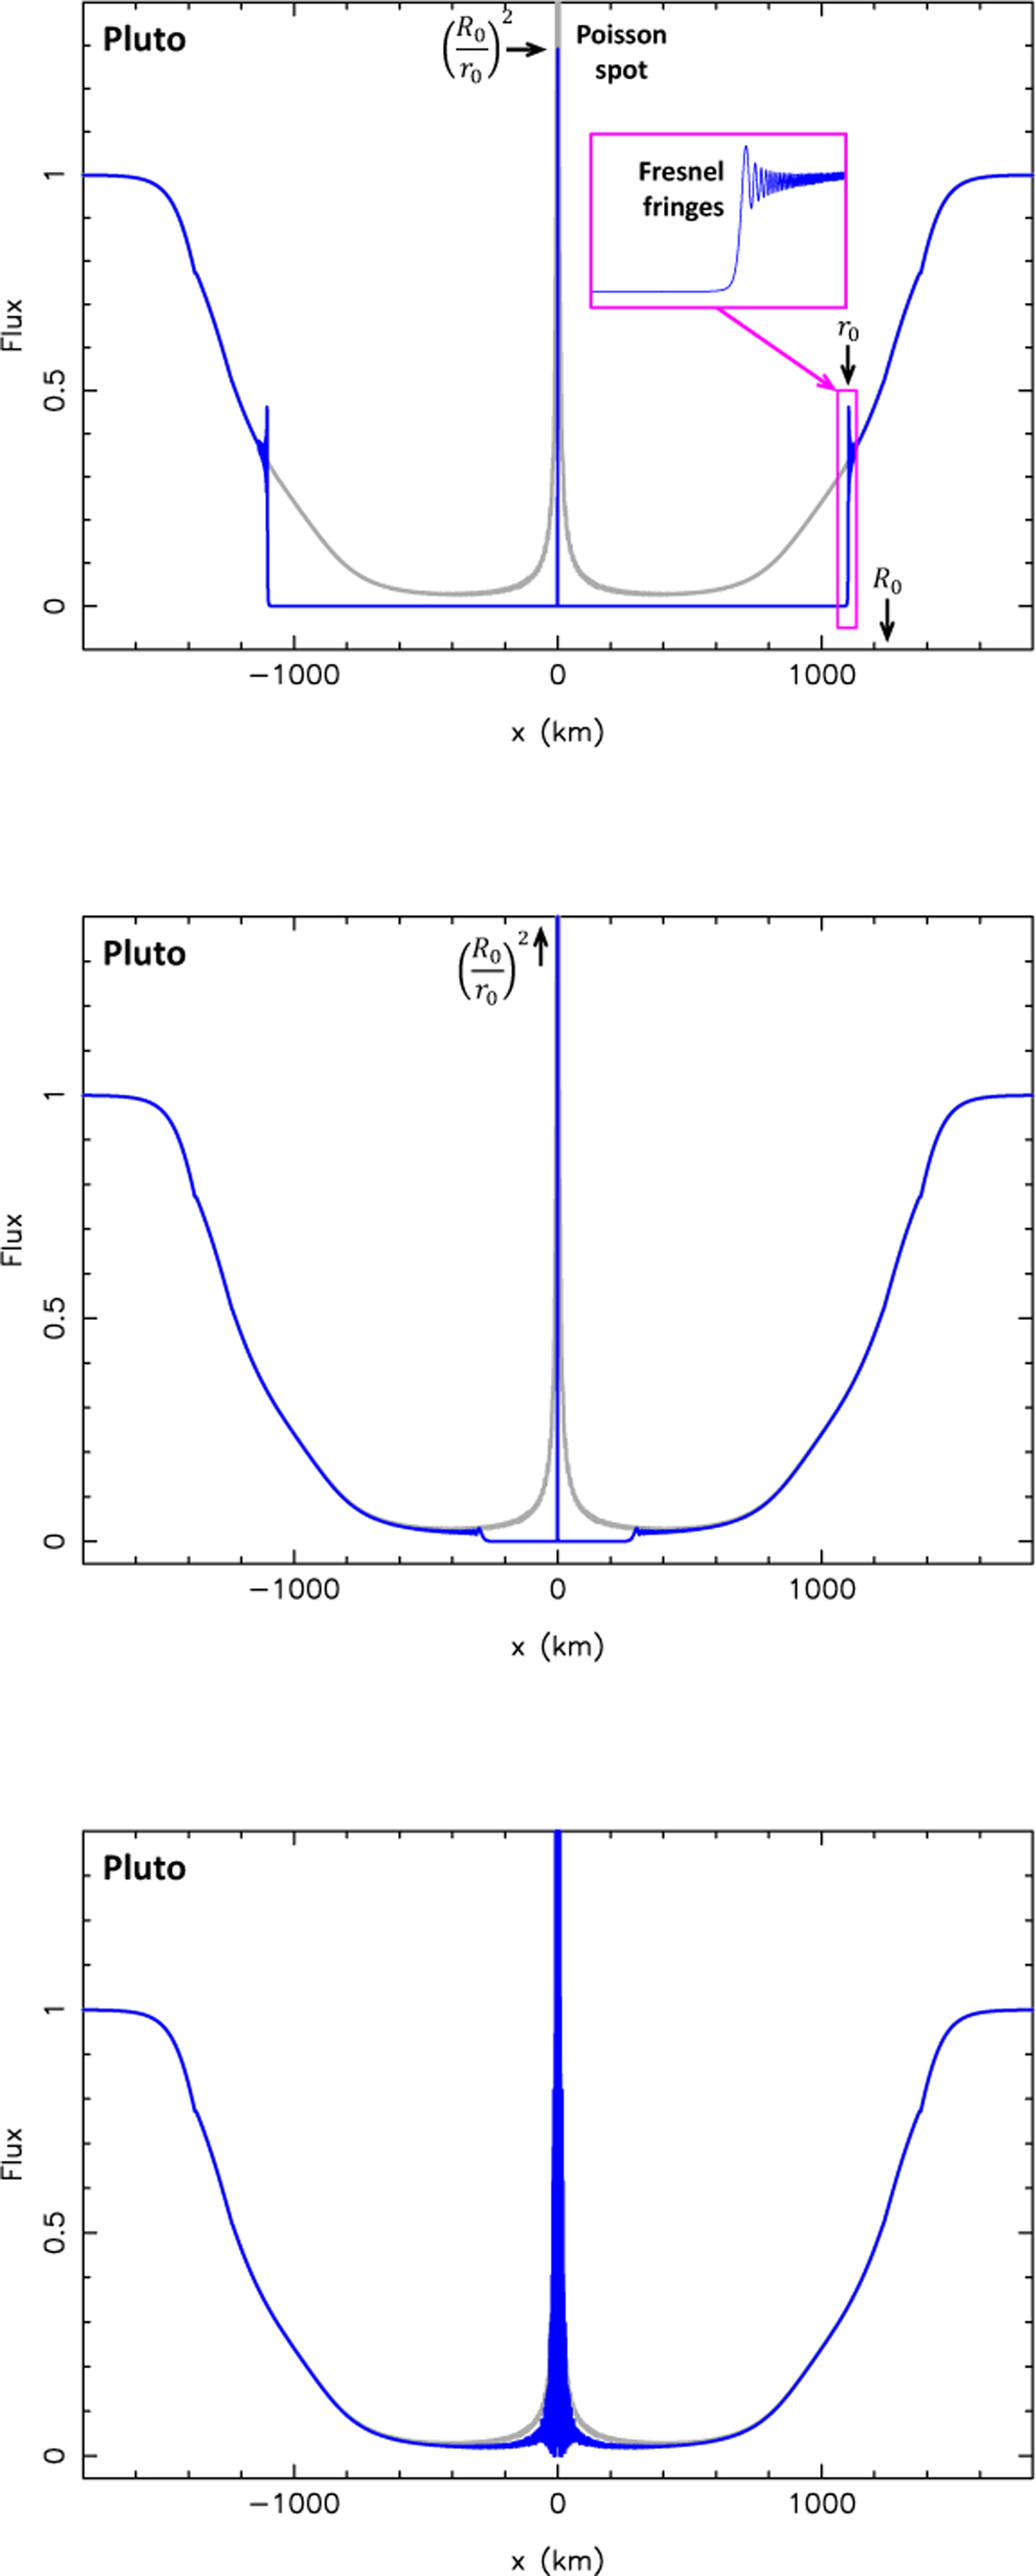
Synthetic light curves showing diametral occultations of a pointlike star by Pluto, taking diffraction into account. The gray curve is the synthetic light curve generated by a ray-tracing code (Dias-Oliveira et al. 2015) based on geometrical optics, with a Pluto geocentric distance ∆ = 33 au and a wavelength λ = 0.6 μm, which yield a Fresnel scale λF = 1.2 km. The code uses the state of Pluto’s atmosphere as of 6 June 2020, assuming pure nitrogen N2 with a surface pressure of 12.2 μbar and a Pluto radius of 1187 km (Sicardy et al. 2021). Upper panel : case of mask with radius R0 = 1250 km placed in front of Pluto, creating a dark shadow of radius r0 = 1100 km. The blue curve was generated using Eqs. (32) and (39). It shows the Fresnel fringes caused by diffraction as the primary image approaches the edge of the mask. The 50-km-wide magenta box shows an expanded view of the Fresnel diffraction, with the first fringes separated by ![]() km (Eq. (39)). The Poisson spot is amplified by the factor (R0/r0)2 compared to the classical Poisson spot created by an airless object (Fig. 3). Middle panel : case R0 = 1192 km, the dark shadow is about to disappear. The central flash predicted by Eq. (32) is now too high to fit in the figure. The Fresnel fringes are barely visible, as their signal is weak due to the smallness of the factor φ1(r0) in Eq. (39). Lower panel : Case R0 = 1191 km marks the transition between the tenuous and dense atmospheres. The dark shadow has disappeared and the highly amplified flash is now described by Eq. (45).
km (Eq. (39)). The Poisson spot is amplified by the factor (R0/r0)2 compared to the classical Poisson spot created by an airless object (Fig. 3). Middle panel : case R0 = 1192 km, the dark shadow is about to disappear. The central flash predicted by Eq. (32) is now too high to fit in the figure. The Fresnel fringes are barely visible, as their signal is weak due to the smallness of the factor φ1(r0) in Eq. (39). Lower panel : Case R0 = 1191 km marks the transition between the tenuous and dense atmospheres. The dark shadow has disappeared and the highly amplified flash is now described by Eq. (45).
Current usage metrics show cumulative count of Article Views (full-text article views including HTML views, PDF and ePub downloads, according to the available data) and Abstracts Views on Vision4Press platform.
Data correspond to usage on the plateform after 2015. The current usage metrics is available 48-96 hours after online publication and is updated daily on week days.
Initial download of the metrics may take a while.