Fig. 7
Download original image
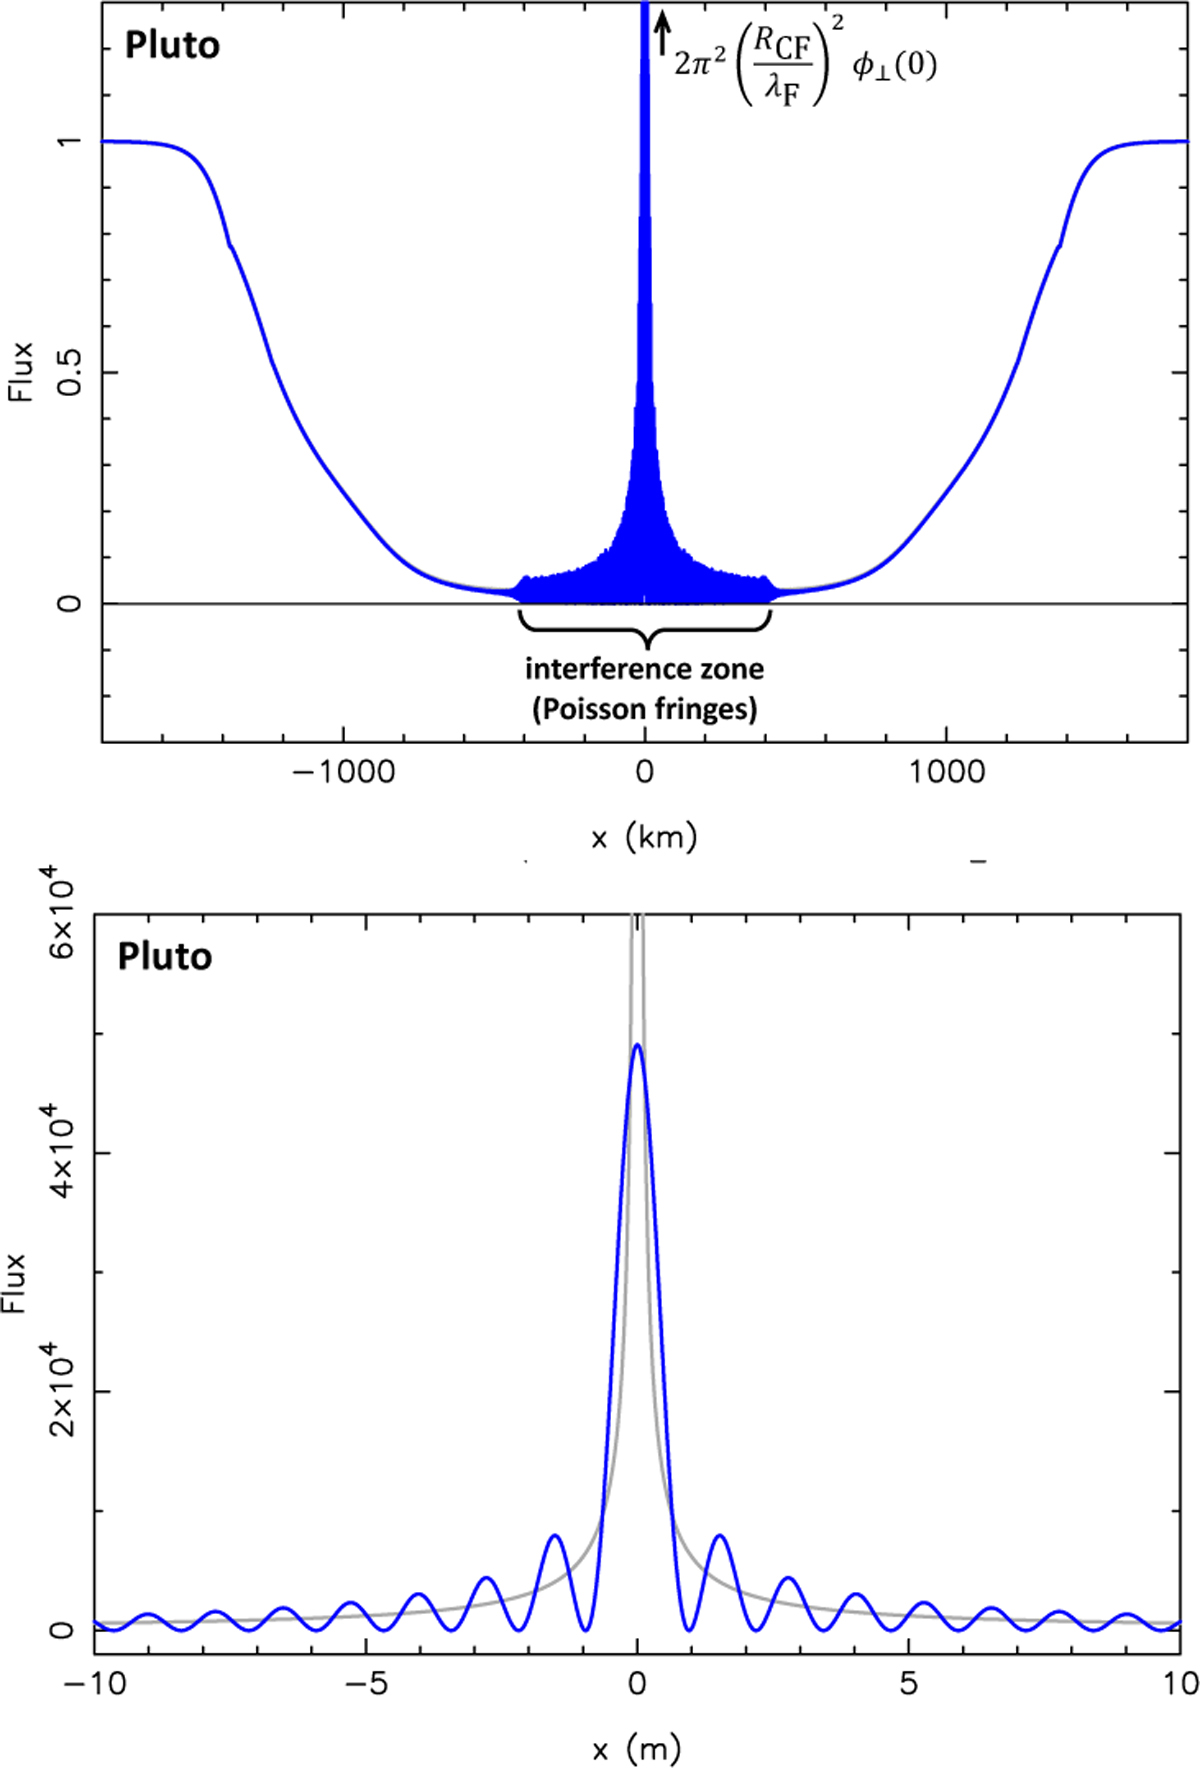
Upper panel : same as Fig. 6 but for R0 = 1190 km, which corresponds to the dense atmosphere case. The flash now reaches its full height, given by Eq. (43). It is too high to fit in the figure, as it reaches a peak value of about 5 × 10⁴; see Table 2 and lower panel. In the region with |x| ≲ 400 km, the two stellar images interfere, causing Poisson fringes in the wings of the central flash. Lower panel : expanded view of the central flash. Note the very large differences in both the horizontal and vertical scales compared to the upper panel. In particular position x is counted in kilometers in the upper panel, and in meters in the lower panel. At that scale, the Poisson fringes are resolved, with a separation of ![]() m (Eq. (28)).
m (Eq. (28)).
Current usage metrics show cumulative count of Article Views (full-text article views including HTML views, PDF and ePub downloads, according to the available data) and Abstracts Views on Vision4Press platform.
Data correspond to usage on the plateform after 2015. The current usage metrics is available 48-96 hours after online publication and is updated daily on week days.
Initial download of the metrics may take a while.