Fig. 1
Download original image
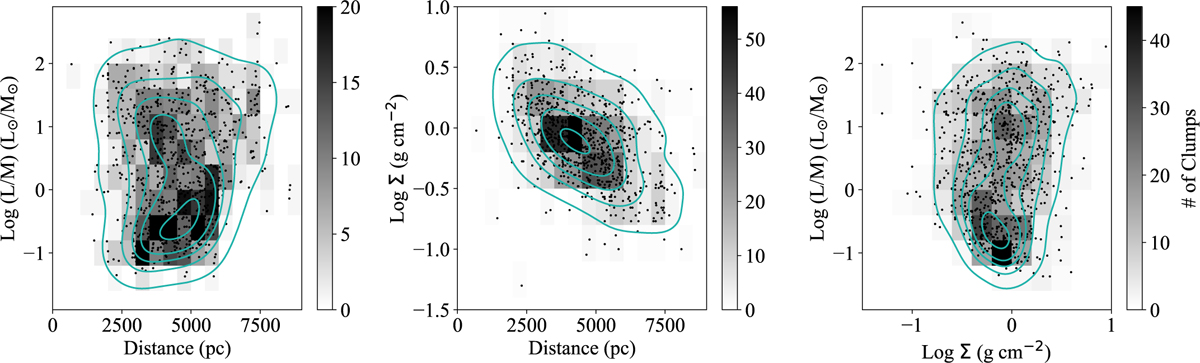
Distribution of the L/M ratio and average surface density, Σcl, as function of the clump heliocentric distance for the ALMAGAL sample, and comparison of these two properties. Each panel includes the 2D density distribution computed dividing the intervals of L/M, Σcl, and dcl into bins of width 0.3 dex, 0.2 dex, and 500 pc, respectively. The solid light gray lines indicate the contour levels of the 2D density distribution derived with kernel density estimation (KDE) corresponding to 10, 30, 50, 70, 95% of the sample.
Current usage metrics show cumulative count of Article Views (full-text article views including HTML views, PDF and ePub downloads, according to the available data) and Abstracts Views on Vision4Press platform.
Data correspond to usage on the plateform after 2015. The current usage metrics is available 48-96 hours after online publication and is updated daily on week days.
Initial download of the metrics may take a while.