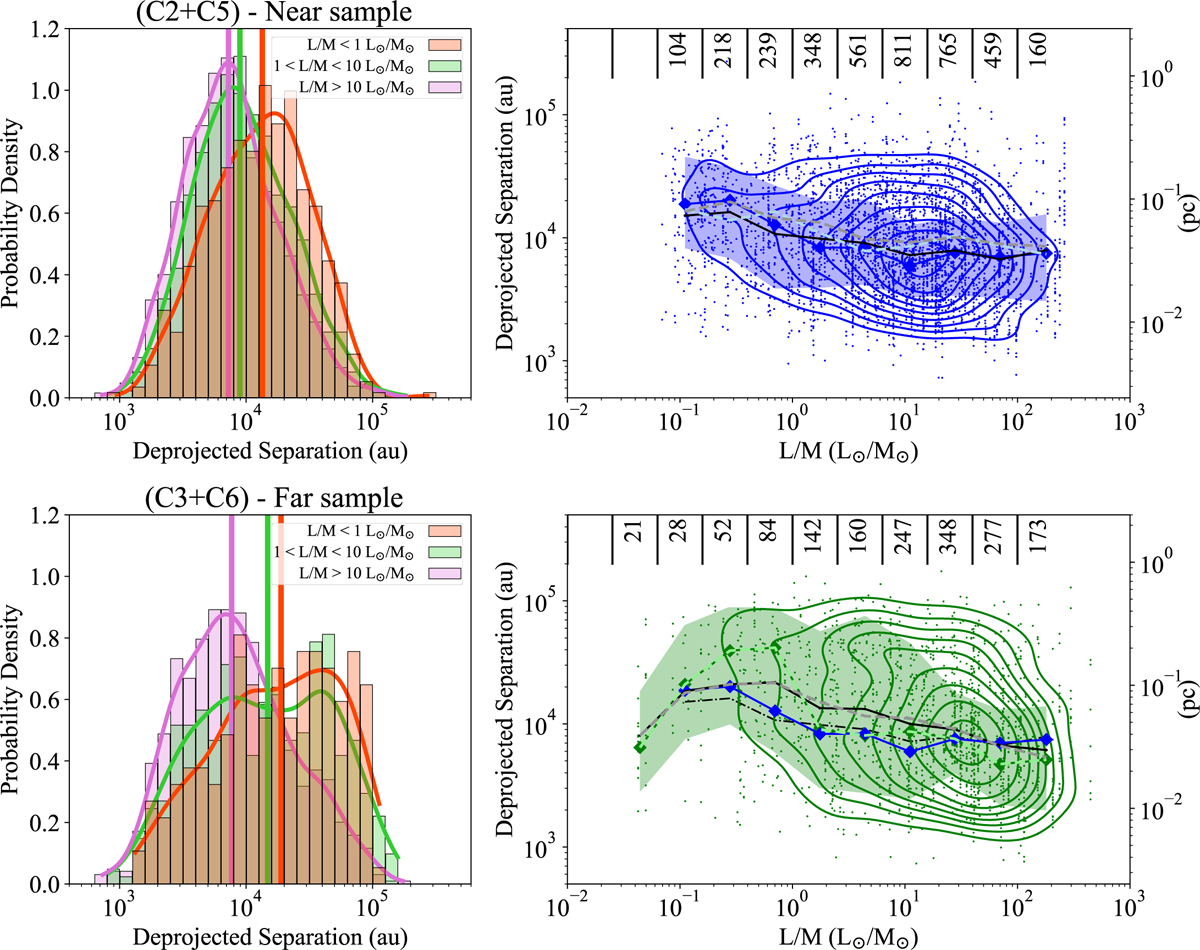
Fig. 10
Download original image
Left panels: density distribution of the deprojected core separations measured in the all clumps with L/M ≤ 1 (orange), 1 ≤ L/M ≤ 10 (green), and L/M ≥ 10 L⊙/M⊙ (purple) with the continuous distribution computed with the KDE method overlapping with the colored continuous line. Clumps of the near and the far are shown in the top and bottom panel, respectively. The colored vertical thick lines show the median of these distributions. Right panels: Deprojected core separations as function of the clump L/M for the systems in the near (top panel) and the far (bottom panel) subsample, respectively. The thick black lines indicate the median of the distributions of the core separations computed in bins of L/M of width 0.3 dex. The thick colored lines, in blue and in green for the near and far subsample, respectively, indicate the peak of these distributions, while the colored area traces their spread defined as the width at 68% of peak intensity. The dashed lines show the variation of the mode (in light blue and green) and of the median computed over subsamples having 3.7 ≤ dcl ≤ 4.7 kpc and 4.7 ≤ dcl ≤ 6.5 kpc. The numbers at the top give the size of the subsamples from which the distribution in each bin is computed. The colored contours trace, from the outside inward, fractions of the sample lying outside that rise from 15% to 95%, with a step of 10% for the near (in blue) and far (in green) subsample, respectively. The median and the peak derived for the near sample are also indicated in the bottom panel for comparison purposes.
Current usage metrics show cumulative count of Article Views (full-text article views including HTML views, PDF and ePub downloads, according to the available data) and Abstracts Views on Vision4Press platform.
Data correspond to usage on the plateform after 2015. The current usage metrics is available 48-96 hours after online publication and is updated daily on week days.
Initial download of the metrics may take a while.