Fig. 11
Download original image
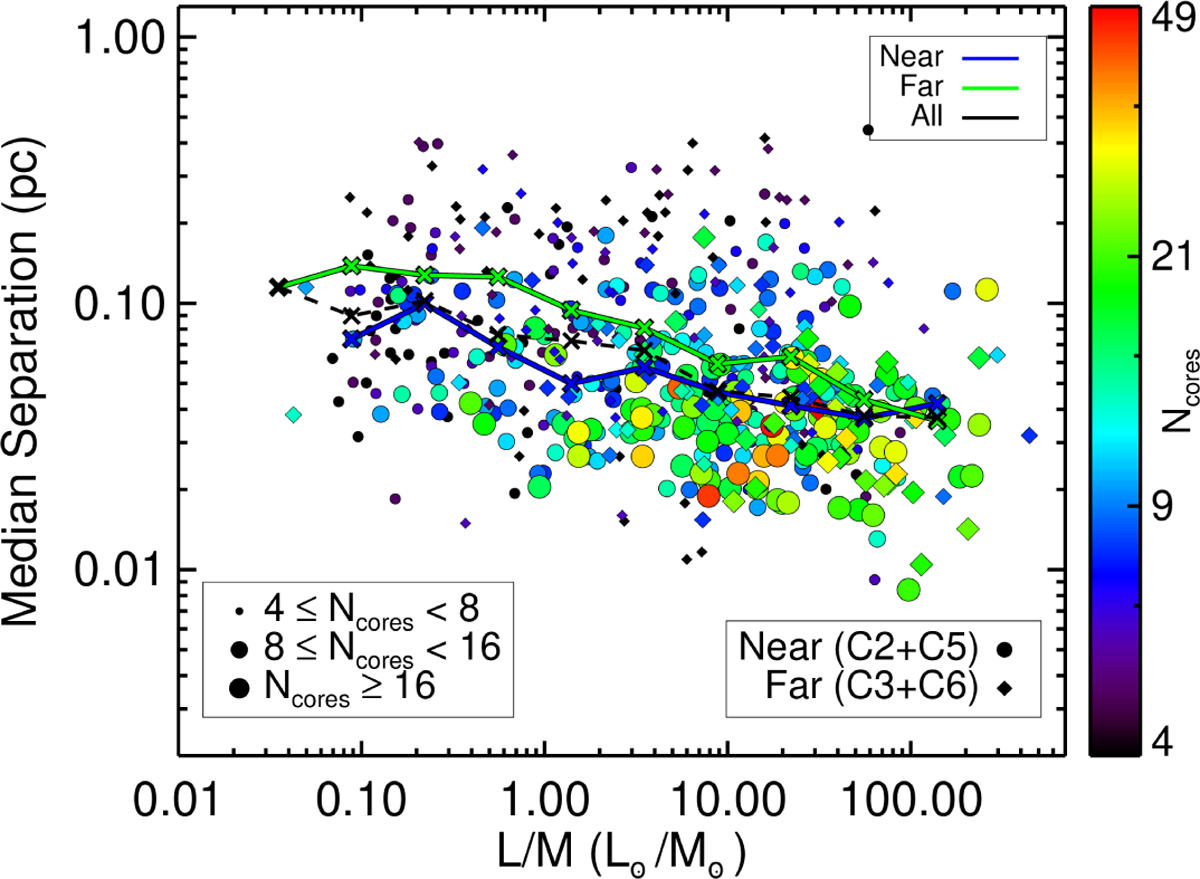
Relation between the clump-averaged separations between the cores provided by the median and the L/M ratio, color-coded to indicate the number of cores detected in the clump. To support the visualization, different sizes are adopted to identify systems 4<Ncores<8 (low), 8 ≤ Ncores<16 (intermediate), and Ncores ≥ 16 (high). The different symbols refer to the clumps of the near (circle) and far (diamond) sample. The solid lines show the median of the distribution of the separations computed in bins of L/M of width 0.4 dex for the near (blue) and far (green) sample, respectively, while the black dashed line corresponds to the median of all the clumps with Ncores ≥ 4.
Current usage metrics show cumulative count of Article Views (full-text article views including HTML views, PDF and ePub downloads, according to the available data) and Abstracts Views on Vision4Press platform.
Data correspond to usage on the plateform after 2015. The current usage metrics is available 48-96 hours after online publication and is updated daily on week days.
Initial download of the metrics may take a while.