Fig. 12
Download original image
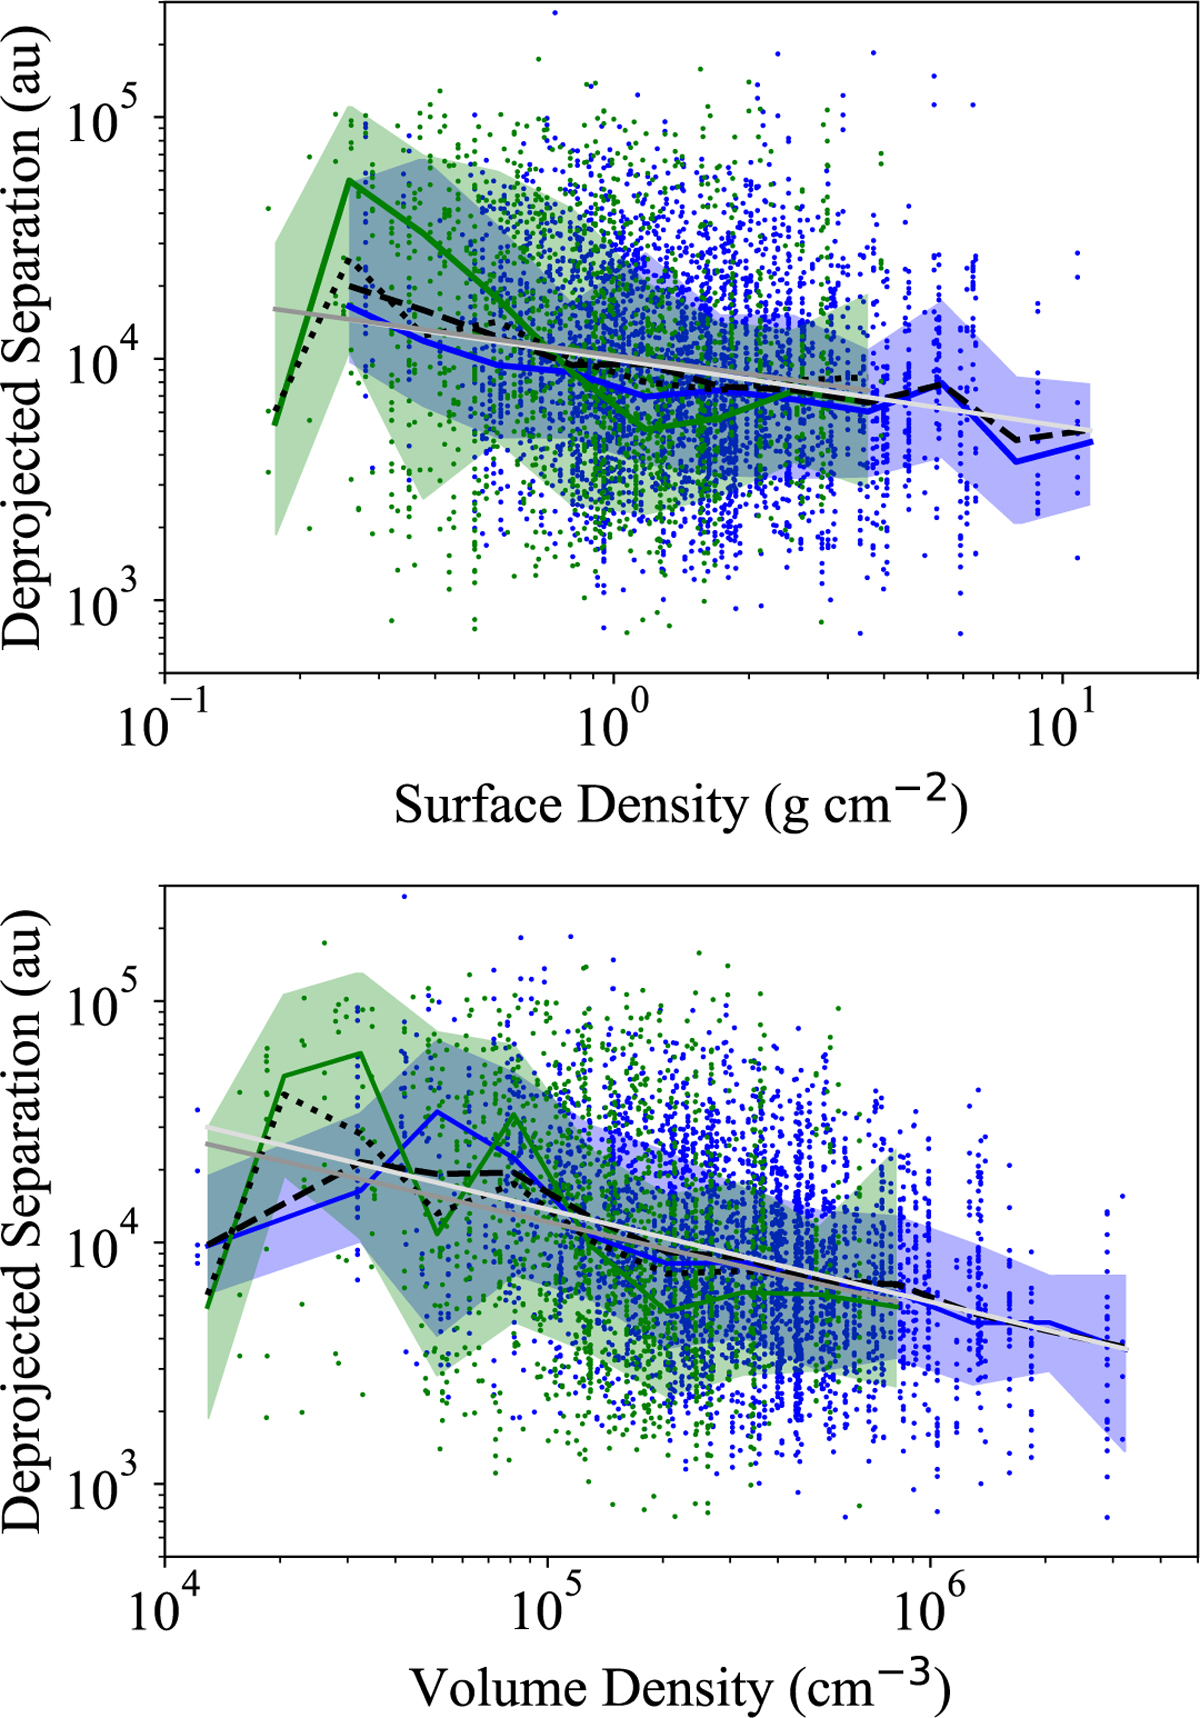
Deprojected core separations against the clump surface (top panel) and volume (bottom panel) density. The distributions of the core separations are computed in bins of Σcl and ncl of width 0.15 and 0.2 dex, respectively. The peaks and spreads of these distributions, defined as the width at 68% peak intensity, are indicated by lines and area for the near (blue) and the far (green) samples, respectively. The medians of the distributions for these two sets are indicated as dashed and dotted black lines, respectively. The best fitting power-law relation computed over the entire set of separations and whose results are reported in Table 5 are indicated as light gray and dark gray lines for the near and far sample, respectively.
Current usage metrics show cumulative count of Article Views (full-text article views including HTML views, PDF and ePub downloads, according to the available data) and Abstracts Views on Vision4Press platform.
Data correspond to usage on the plateform after 2015. The current usage metrics is available 48-96 hours after online publication and is updated daily on week days.
Initial download of the metrics may take a while.