Fig. 13
Download original image
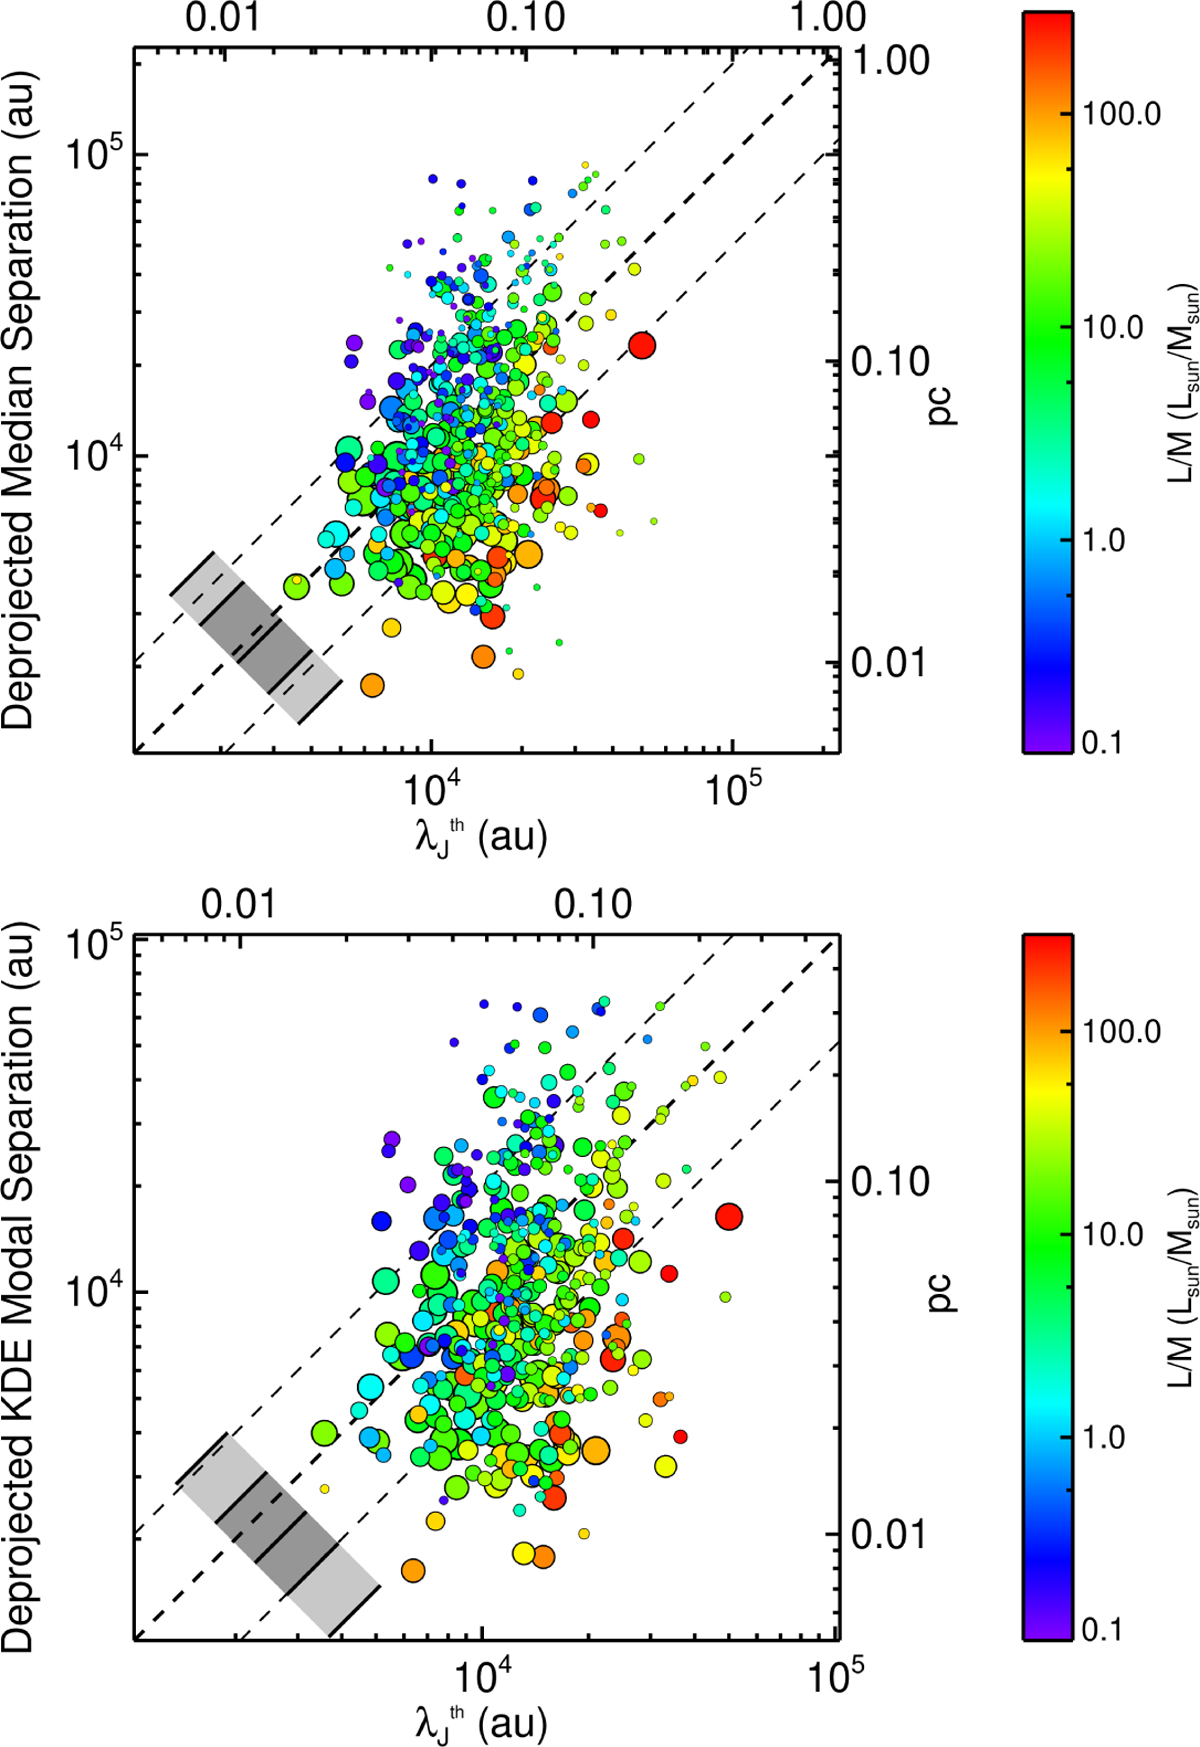
Comparison between the clump-averaged estimators for the core separations, specifically the median (top panel) and mode (bottom panel) of the distribution in each clump, and the computed Jeans length. The fragmentation level in the clump is indicated by the symbol sizes, with increasing size going from low (4 ≤ Ncores<8) and intermediate (8 ≤ Ncores<16), up to high (Ncores ≥ 16) core numbers. The dashed lines are drawn as a reference and correspond to the separation equal to ![]() (thick line) and 2 × and
(thick line) and 2 × and ![]() (thin lines), respectively. The gray shaded boxes indicate the amplitude of the distributions of the ratio
(thin lines), respectively. The gray shaded boxes indicate the amplitude of the distributions of the ratio ![]() (see text), and correspond to the interquartile range (dark gray) and the 10th to 90th percentile range (light gray), respectively.
(see text), and correspond to the interquartile range (dark gray) and the 10th to 90th percentile range (light gray), respectively.
Current usage metrics show cumulative count of Article Views (full-text article views including HTML views, PDF and ePub downloads, according to the available data) and Abstracts Views on Vision4Press platform.
Data correspond to usage on the plateform after 2015. The current usage metrics is available 48-96 hours after online publication and is updated daily on week days.
Initial download of the metrics may take a while.