Fig. 14
Download original image
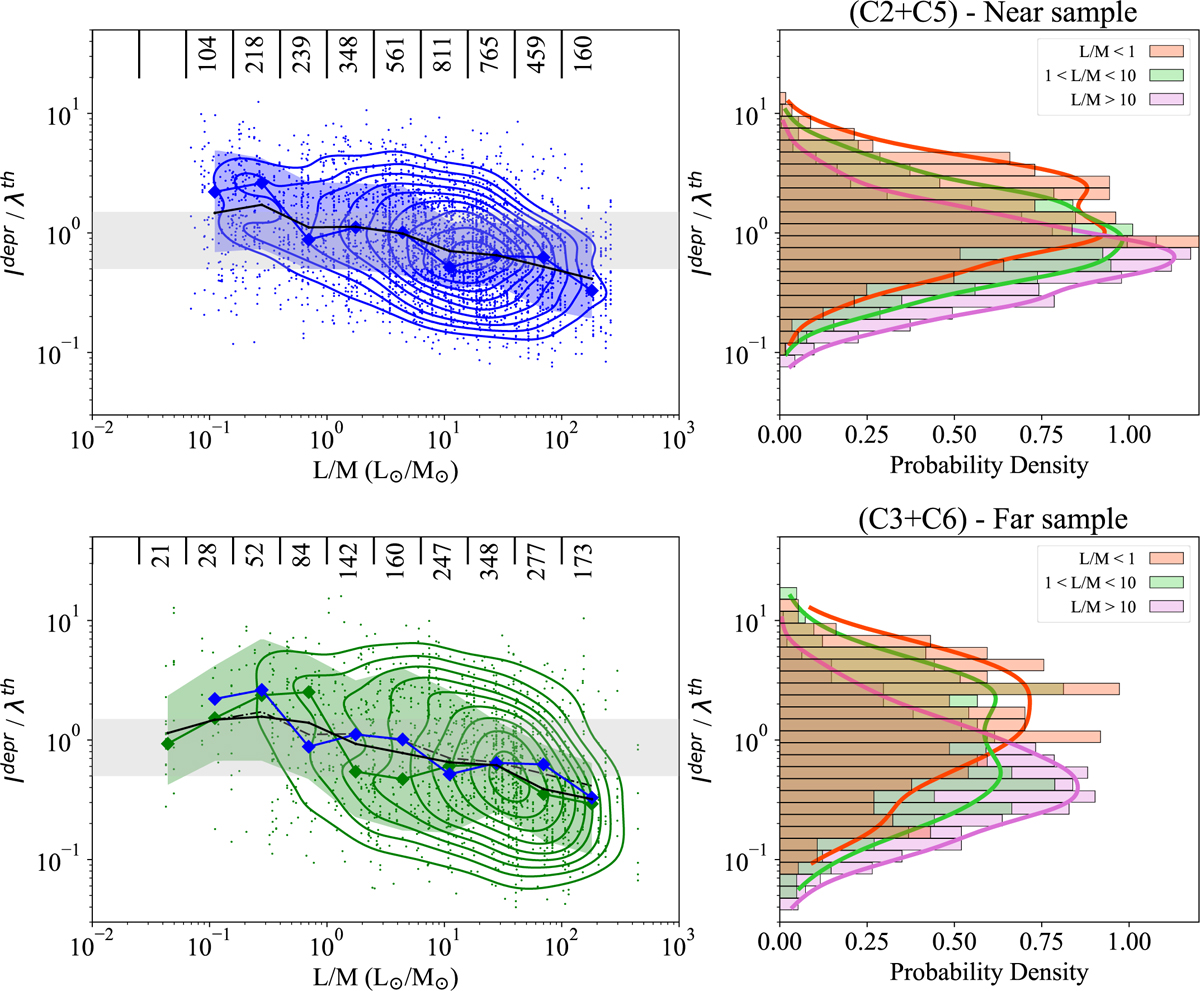
Left panel: comparison of the ratio R of the deprojected separations to ![]() and the clump L/M ratio for the near (top panel) and far sample (bottom panel), respectively. The black dashed line shows the median of the distributions of R computed in bins of L/M equally spaced in logarithm of width 0.4 dex. The thick colored lines and the colored area trace the mode and the spread (defined as the width at 68% of the peak) of these distributions, adopting the blue and green colors for the near and far sample, respectively. The numbers at the top give the size of the subsamples adopted to compute the distribution in each bin. The gray shaded area shows the interval 0.5 ≤ R ≤ 1.5, corresponding to an uncertainty on the
and the clump L/M ratio for the near (top panel) and far sample (bottom panel), respectively. The black dashed line shows the median of the distributions of R computed in bins of L/M equally spaced in logarithm of width 0.4 dex. The thick colored lines and the colored area trace the mode and the spread (defined as the width at 68% of the peak) of these distributions, adopting the blue and green colors for the near and far sample, respectively. The numbers at the top give the size of the subsamples adopted to compute the distribution in each bin. The gray shaded area shows the interval 0.5 ≤ R ≤ 1.5, corresponding to an uncertainty on the ![]() of a factor of 2. The colored contours trace, from the outside inward, fractions of the sample lying outside that rise from 15% to 95% with a step of 10% for the near (in blue) and the far (in green) subsample, respectively. Right panel: normalized density histogram and estimated probability density distribution estimated with the KDE method (colored continuous lines) of the ratio
of a factor of 2. The colored contours trace, from the outside inward, fractions of the sample lying outside that rise from 15% to 95% with a step of 10% for the near (in blue) and the far (in green) subsample, respectively. Right panel: normalized density histogram and estimated probability density distribution estimated with the KDE method (colored continuous lines) of the ratio ![]() measured in the three subsamples selected by different intervals of L/M tracing clumps in different evolutionary phases: young (L/M ≤ 1 L⊙/M⊙ in orange), intermediate (1 ≤ L/M ≤ 10 L⊙/M⊙ in green), and evolved (L/M ≥ 10 L⊙/M⊙ in purple).
measured in the three subsamples selected by different intervals of L/M tracing clumps in different evolutionary phases: young (L/M ≤ 1 L⊙/M⊙ in orange), intermediate (1 ≤ L/M ≤ 10 L⊙/M⊙ in green), and evolved (L/M ≥ 10 L⊙/M⊙ in purple).
Current usage metrics show cumulative count of Article Views (full-text article views including HTML views, PDF and ePub downloads, according to the available data) and Abstracts Views on Vision4Press platform.
Data correspond to usage on the plateform after 2015. The current usage metrics is available 48-96 hours after online publication and is updated daily on week days.
Initial download of the metrics may take a while.