Fig. 15
Download original image
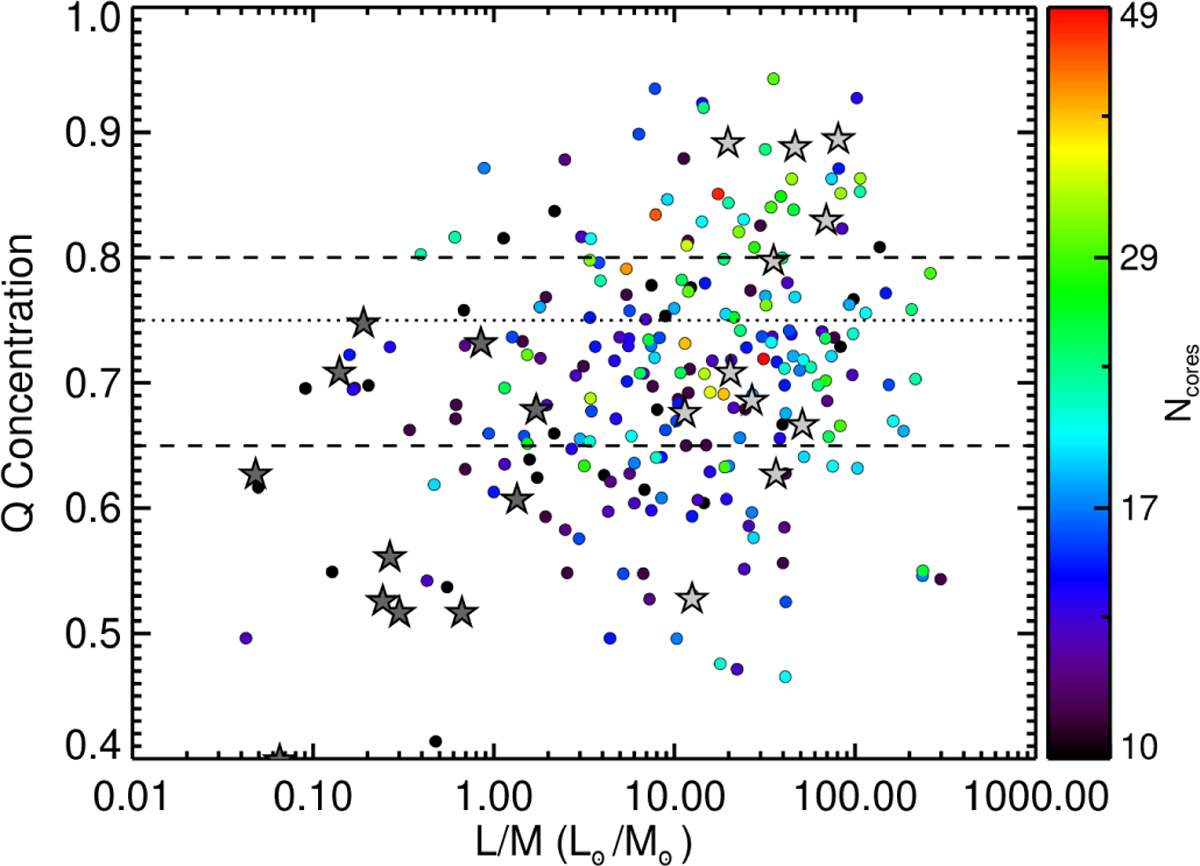
Relation between the Q parameter and the L/M ratio of ALMAGAL clumps which host at least ten cores. The two dashed lines values Q=0.65 and Q=0.8 defining the intervals for which it is most likely that the hosted cores follow a fractal type of subclustering (Q ≤ 0.65) and radial distribution with a central concentration (Q ≥ 0.8), as indicated by the Monte Carlo simulations in Appendix D. The dotted line points to the Q=0.75, which separates the two regimes with a lower statistical significance. Estimates from the ASHES (dark gray; Sanhueza et al. 2019) and ASSEMBLE surveys (light gray; Xu et al. 2024) are included, and are shown as star markers.
Current usage metrics show cumulative count of Article Views (full-text article views including HTML views, PDF and ePub downloads, according to the available data) and Abstracts Views on Vision4Press platform.
Data correspond to usage on the plateform after 2015. The current usage metrics is available 48-96 hours after online publication and is updated daily on week days.
Initial download of the metrics may take a while.